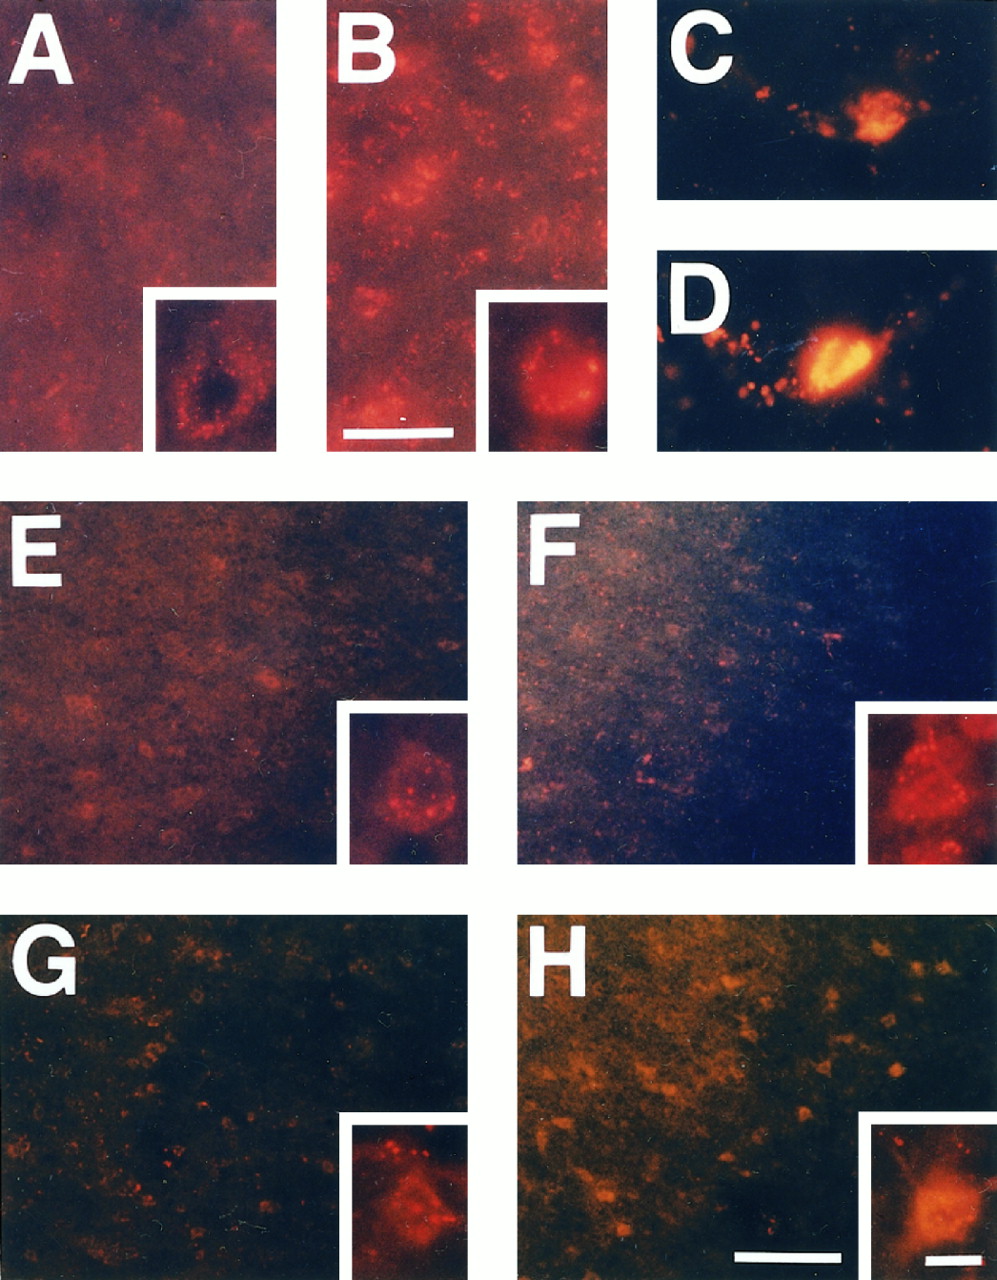
Representative photomicrographs showing increased production of O2− by the expression of oxidized HEt in Sod2 −/+ mouse brains. The basal level of O2− was increased even under normal physiological conditions in the knock-out mutant mice (B) as compared with wild-type animals (A), reflecting decreased activity of Mn-SOD. Under normal physiological conditions, HEt signals were detected as small particles in the cytosol, indicating mitochondrial production of O2−. These small particles were likely to be increased and intense in knock-out mutants. Endothelial cells demonstrated strong fluorescent signals rather than other cell populations under both normal (C) and ischemic conditions (D). E, F, Ischemic area showing increased production of O2− at 1 hr after ischemia induction. In the ischemic brain tissue, including the cortex and caudoputamen, these small red particles were increased slightly in both wild-type animals (E) and knock-out mice (F) at 1 hr. However, these HEt signals were likely to indicate not a cytosolic, but a mitochondrial, expression of O2−, and the difference was not remarkable between wild-type mice and knock-out mutants.G, H, At 4 hr, although a great deal of HEt was supposed to have been oxidized to Et, the intense and different subcellular pattern of the HEt signal was observed. Some cells in the ischemic area exhibited cytosolic expression of O2−. This fluorescent signal, which filled up the cytosolic space, displayed the shape of those cells. Furthermore, these cells with a cytosolic expression pattern of HEt were observed more frequently in theSod2 knock-out mutants (G) than in the wild-type mice (H), particularly in the penumbra area. Scale bars: 25 μm in A,B; 100 μm in E–H; 10 μm inC, D and the high magnification inA, B, E–H.


