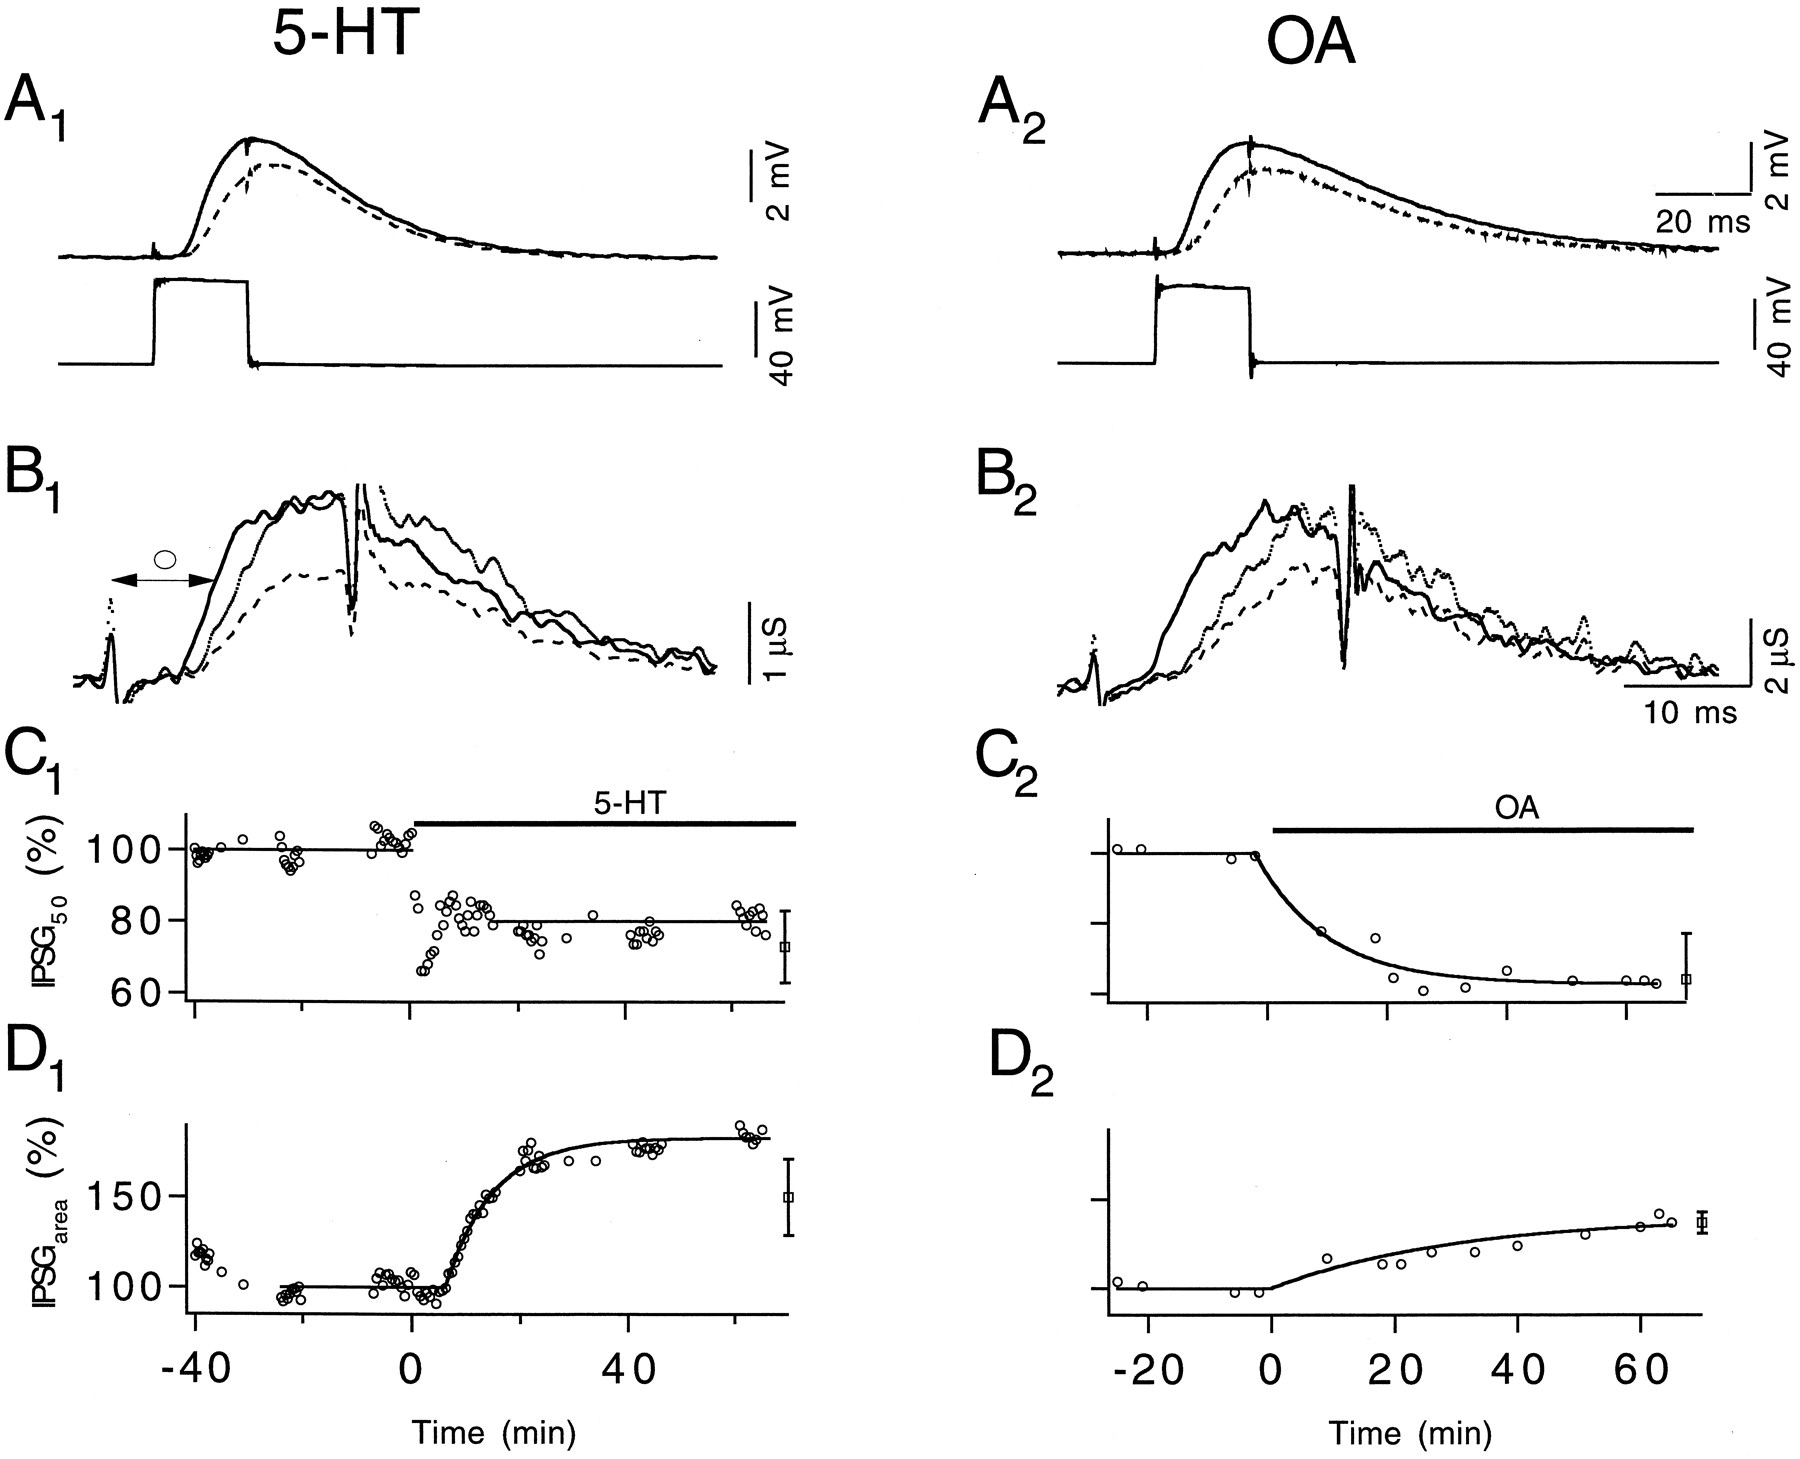
5-HT and OA accelerate release kinetics and increase IPSGarea. A, Pre- (lower) and postsynaptic (upper) potentials recorded 5 min before (dashed line) and ∼50 min after (solid line) 100 nm 5-HT (A1 ) and 2.5 μm OA (A2 ) were applied. Presynaptic steps were 20 msec in duration and depolarized to 0 mV. A1 andA2 share the same time scale. B, IPSGs converted from IPSPs shown in A. 5-HT (B1 ) and OA (B2 ) increase IPSGarea significantly. The kinetics of IPSG is quantified by measuring the interval between the beginning of the pulse and the half-maximum point of IPSG (○). B1 andB2 share the same time scale. C, Changes of IPSG50 over time after 5-HT (C1 ) and OA (C2 ) application. Y-scales are identical on both graphs. Averaged results, with SD, are shown at the end (see Results).D, Time course of change in IPSGarea in response to 5-HT (D1 ) and OA (D2 ) application. Y-scales are identical on both graphs. Averaged results, with SD, are shown at the end (see Results). ΔECl,Rm, and τm of the muscle fiber measured before and after 5-HT application were 10.1 mV, 0.47 MΩ, 9.2 msec and 10.3 mV, 0.47 MΩ, 8.9 msec, respectively. The membrane characteristics of the muscle fiber used in the OA experiment were 5.6 mV, 0.66 MΩ, 13.8 msec and 6.2 mV, 0.75 MΩ, 17.0 msec, respectively.


