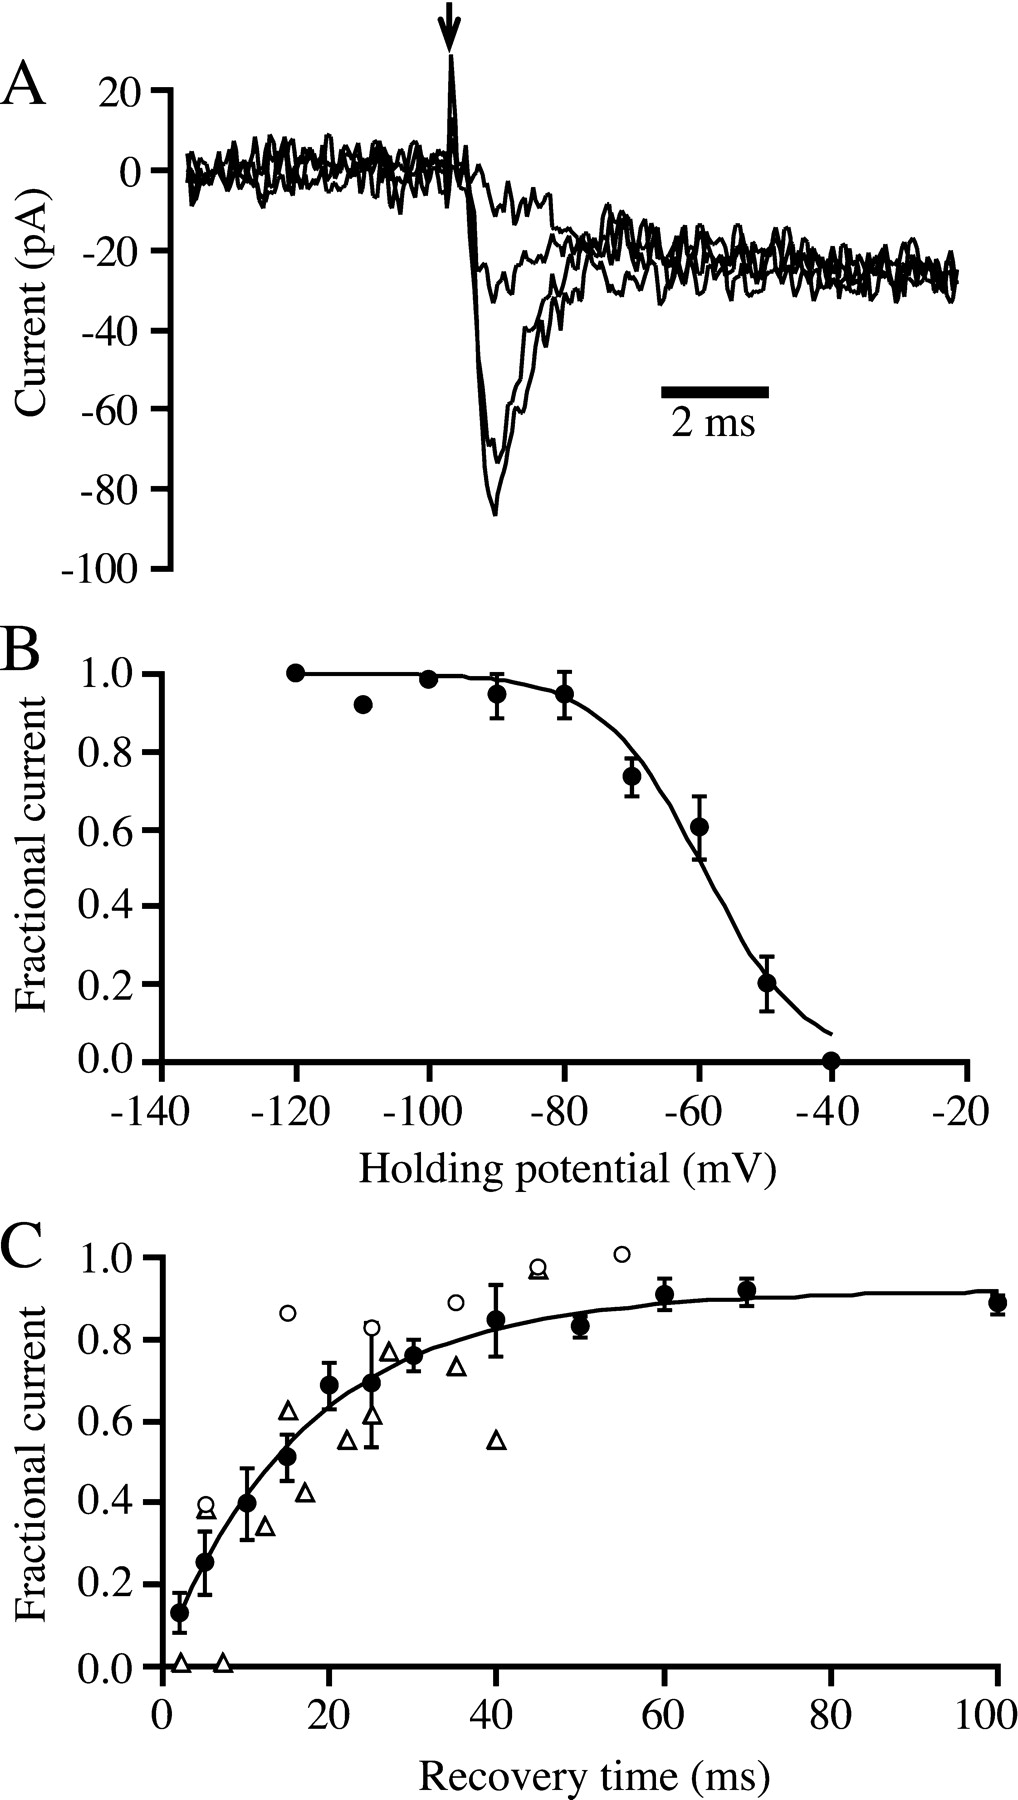
Inactivation of sodium channels. A, Whole-cell membrane currents in response to a voltage-clamp step from various holding potentials to 0 mV. The superimposed traces show responses with holding potentials of −40, −50, −70, and −90 mV. Holding potential was set manually and was maintained for tens of seconds before test pulses were applied. B, Voltage dependence of inactivation of sodium current. To compare results across cells, the peak inward current at each holding potential for each cell was normalized by dividing by the current at a holding potential of −120 mV. Each data point shows the average normalized current from three to five bipolar cells. The solid line was drawn according to a Boltzmann relation: fractional recovery = 1/(1 + exp((V −Vh)/c)), whereVh is the half-inactivating voltage (−59 mV) and c is the voltage change that produces an e-fold change in inactivation (7.5 mV). C, Recovery from inactivation. After inactivation by a 50 msec pulse to 0 mV, voltage was returned to −70 mV for various times, and recovery was tested by a second voltage-clamp step to 0 mV. The curve through the data points represents the best-fitting sum of two exponentials. The shorter time constant was 12 msec (weight = 0.75), and the longer time constant was 80 msec (weight = 0.25). Each data point (filled circles) shows the average from three to six cells. Current for each cell was normalized with respect to the control current before the inactivating prepulse. Thetriangles show results from two cells in which the holding potential during the recovery period was −60 mV, and theopen circles show results from a single cell at a holding potential of −80 mV.


