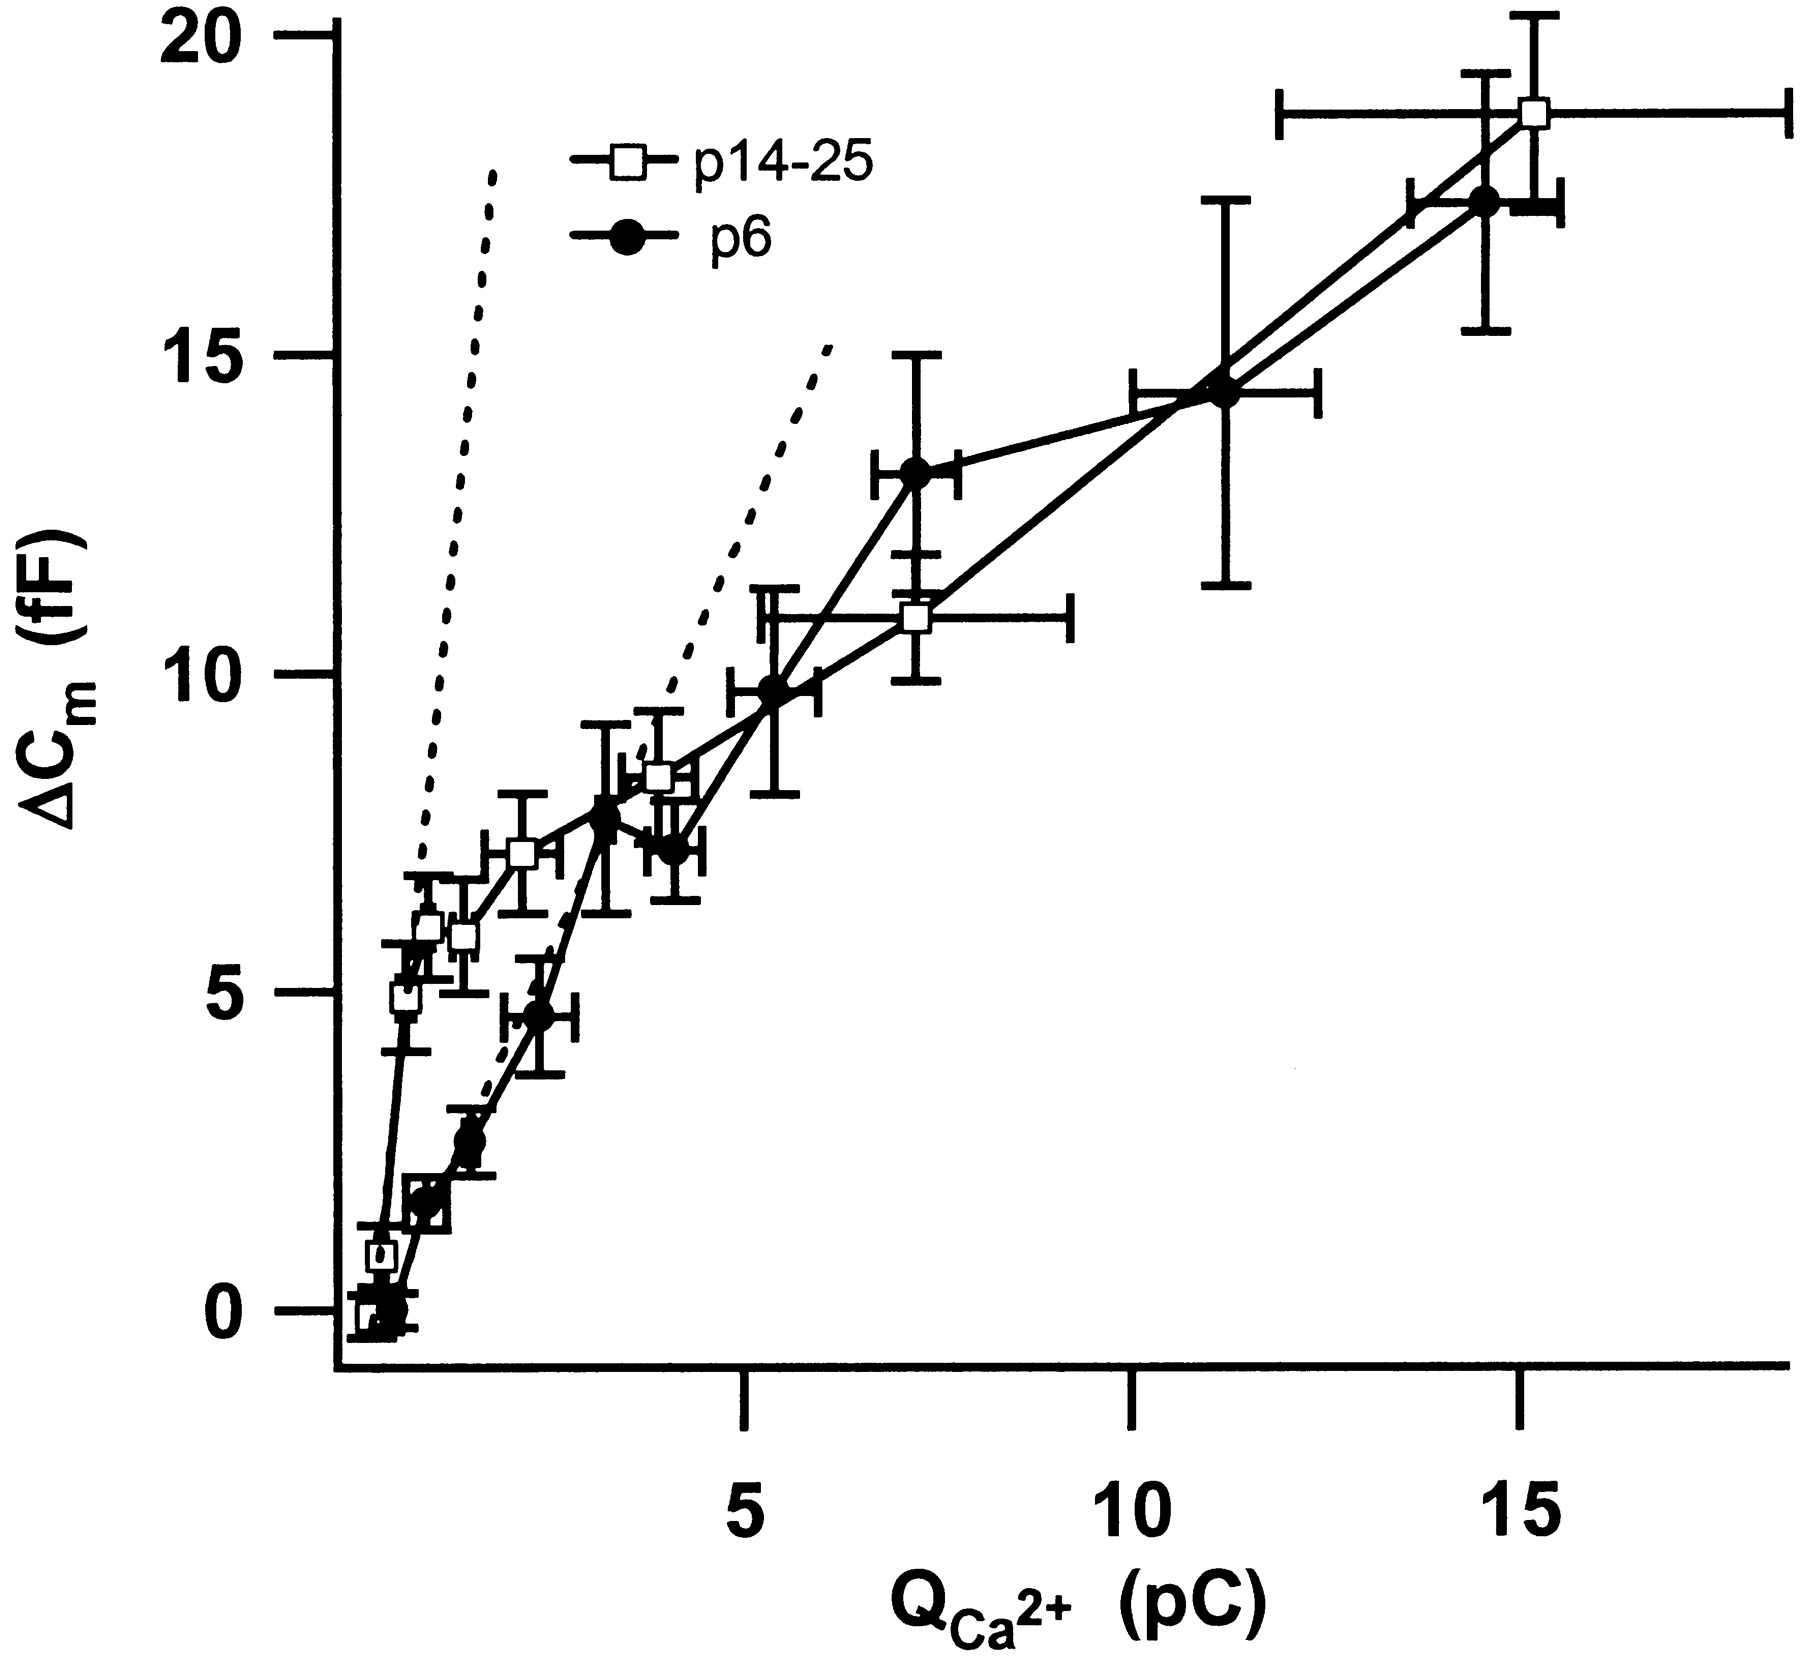
Fig. 4.
Ca2+ dependence of exocytosis during and after maturation. The plot relates secretory responses of 5 mm EGTA-buffered IHCs from P6 and P14–P25 mice to their Ca2+ current integrals (restricted to small integrals; n = 9 cells for P6 andn = 27 for P14–P25 IHCs). The dashed lines represent linear fits to the first three points of each data set.


