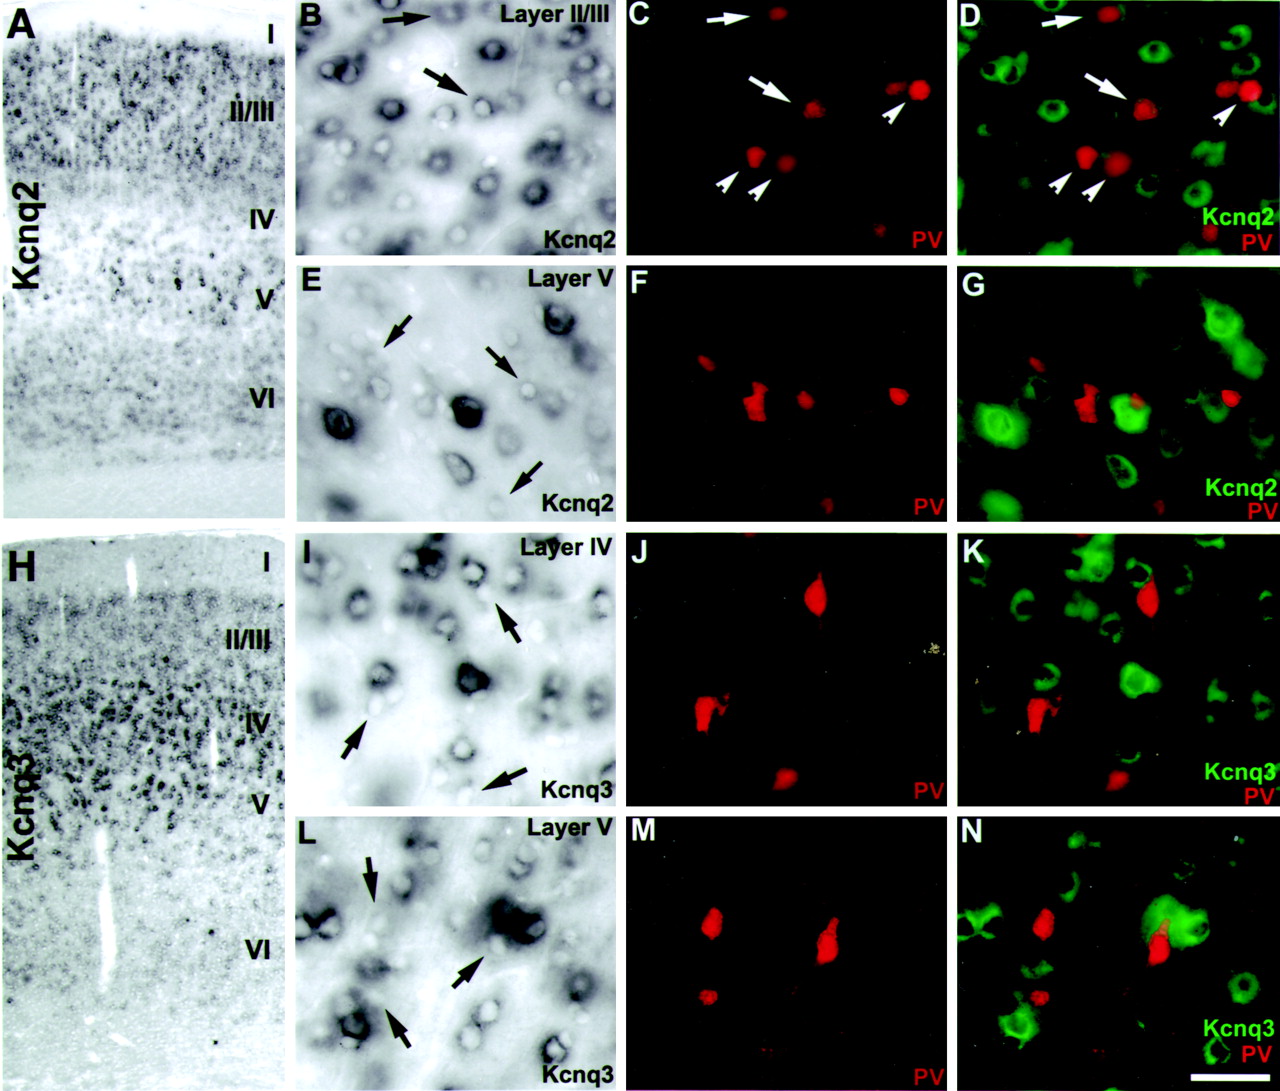
Differential distributions of Kcnq2 and Kcnq3 transcripts in rat cerebral cortex. A, Cross section of rat cerebral cortex showing strong Kcnq2-positive neurons in layers II/III and V, and little or no signal in layer IV.B, High-power bright-field image showing layer II/III Kcnq2-positive neurons. C, Same image asB, with immunodetection of PV-reactive interneurons.D, Overlay of B–D with Kcnq2 pseudocolored green. Note that some Kcnq2 transcripts colocalize with PV-positive interneurons (B–D,arrows), and some do not (B–D,arrowheads). E, High-power bright-field image showing strong Kcnq2 signal in a large layer V pyramidal neuron.F, Same image as E, with immunodetection of PV-reactive interneurons. G, Overlay ofE and F with Kcnq2 pseudocoloredgreen. Note that most Kcnq2 transcripts did not colocalize with PV-positive interneurons (E,arrows). H, ISH for Kcnq3 showing labeling of neurons in cortical layers II–VI, with highest levels found in layer IV. I–N, Kcnq3 expression is not found in PV-positive cortical interneurons in cortical layer IV (I–K) or V (L–N). I, High-power image of Kcnq3-labeled neurons in cortical layer IV.J, Immunofluorescent detection of PV in I. K, Overlay of I and J with Kcnq3 pseudocolored green. L, High-power image of Kcnq3-labeled neurons in cortical layer V. M, Immunofluorescent detection of PV in L. N, Overlay of L and M with Kcnq3 pseudocoloredgreen. Arrows in I andL point to Kcnq3-negative cells that were immunoreactive for PV. Scale bar (shown in N): A,H, 200 μm; B–G,I–N, 50 μm.


