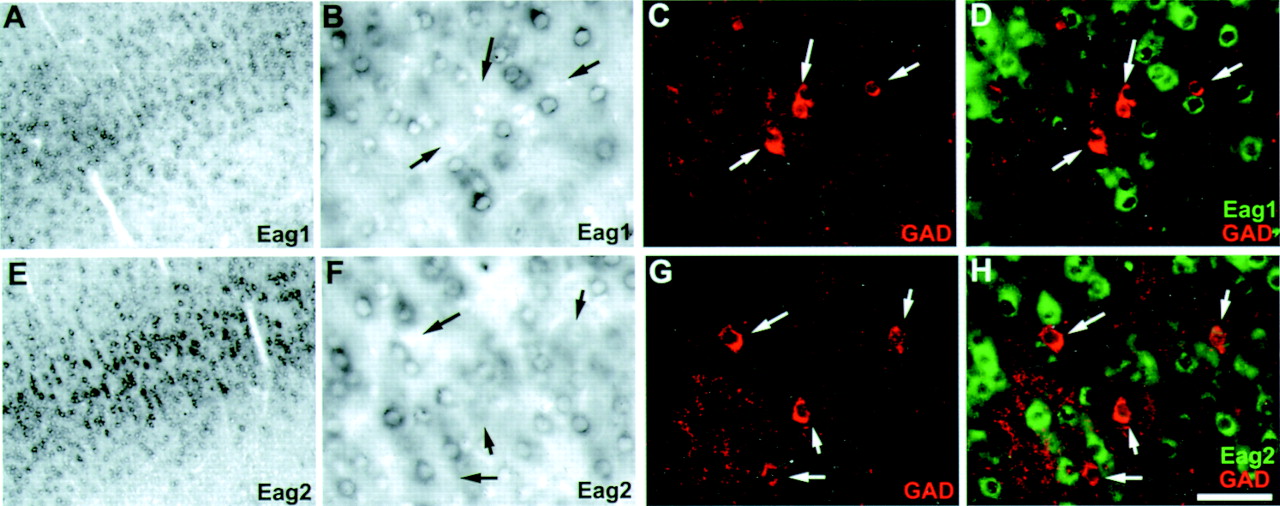
Fig. 3.
Eag1 and eag2 transcripts are not found in inhibitory cells of the cortex. A–D, Dual detection of eag1 and GAD in cortical layer IV. A, Low-magnification bright-field image of eag1 expression in cortical layer IV.B, High-magnification bright-field image ofA showing eag1 expression in many small non-pyramidal neurons. C, Immunofluorescent detection of GAD immunoreactive interneurons. D, Overlay ofB and C with eag1 expression pseudocolored green. Note GAD+ neurons are not labeled for eag1 (arrows). E–H, Same asA–D, but for eag2. Note eag2 transcripts do not colocalize with GAD+ immunoreactive neurons (arrows). Scale bar (shown in H): B–D,F–H, 50 μm; A, E, 200 μm.


