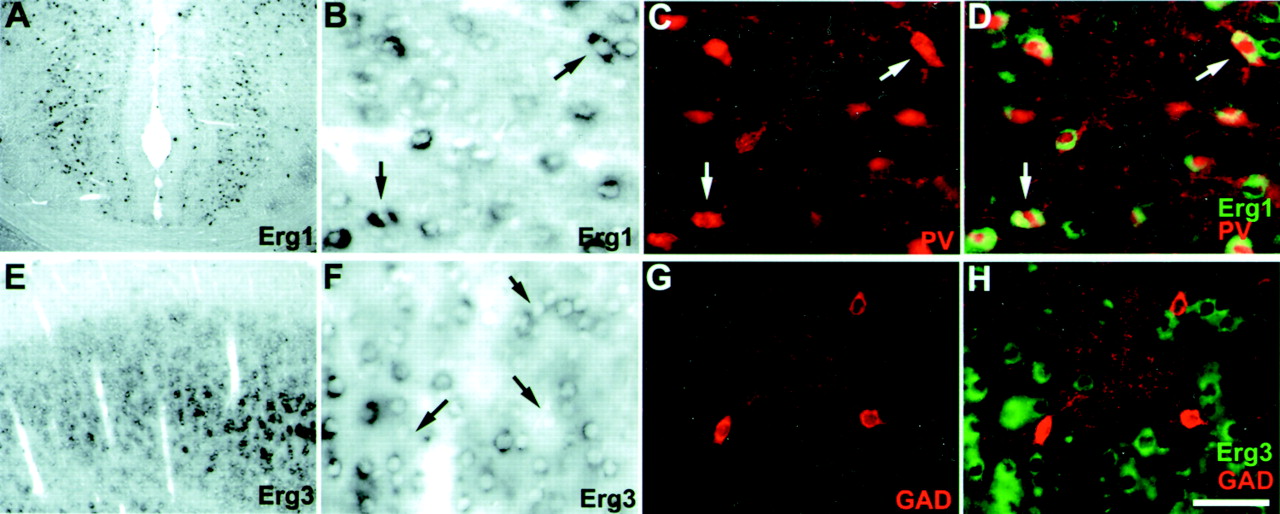
Erg1 is located in a population of parvalbumin-containing interneurons in the cingulate cortex, whereas erg3 is found only in excitatory neurons in the cerebral cortex.A, Relatively strong erg1 expression was found within neurons of the cingulate cortex. B–D, Identification of a population of erg1-positive interneurons in the cingulate cortex by dual labeling with PV. B, High-power bright-field image of erg1-positive neurons from A. Note that erg1-positive neurons are scattered and strongly labeled. C, Immunofluorescent detection of PV-containing interneurons.D, Overlay of B and C with erg1 signals pseudocolored green. Note that nearly all PV-positive neurons are also expressing erg1 transcripts. Characteristic labeling of interneurons by ISH, revealing a bipolar shape, is evident in bright field (arrows).E–H, Unlike erg1, erg3 expression is not found in inhibitory neurons of the cortex. E, Low-power bright-field image showing erg3 expression in cortical layers II/III.F, High-magnification bright-field image of erg3-positive cells in cortical layer III. G, Immunodetection of GAD-immunoreactive interneurons. H, Overlay of F and G with erg3 signals pseudocolored green. Note that GAD-positive cells do not express erg3 (F, arrows point to unlabeled GAD+ cells). Scale bar (shown in H):A, E, 500 μm; B–D,E–H, 50 μm.


