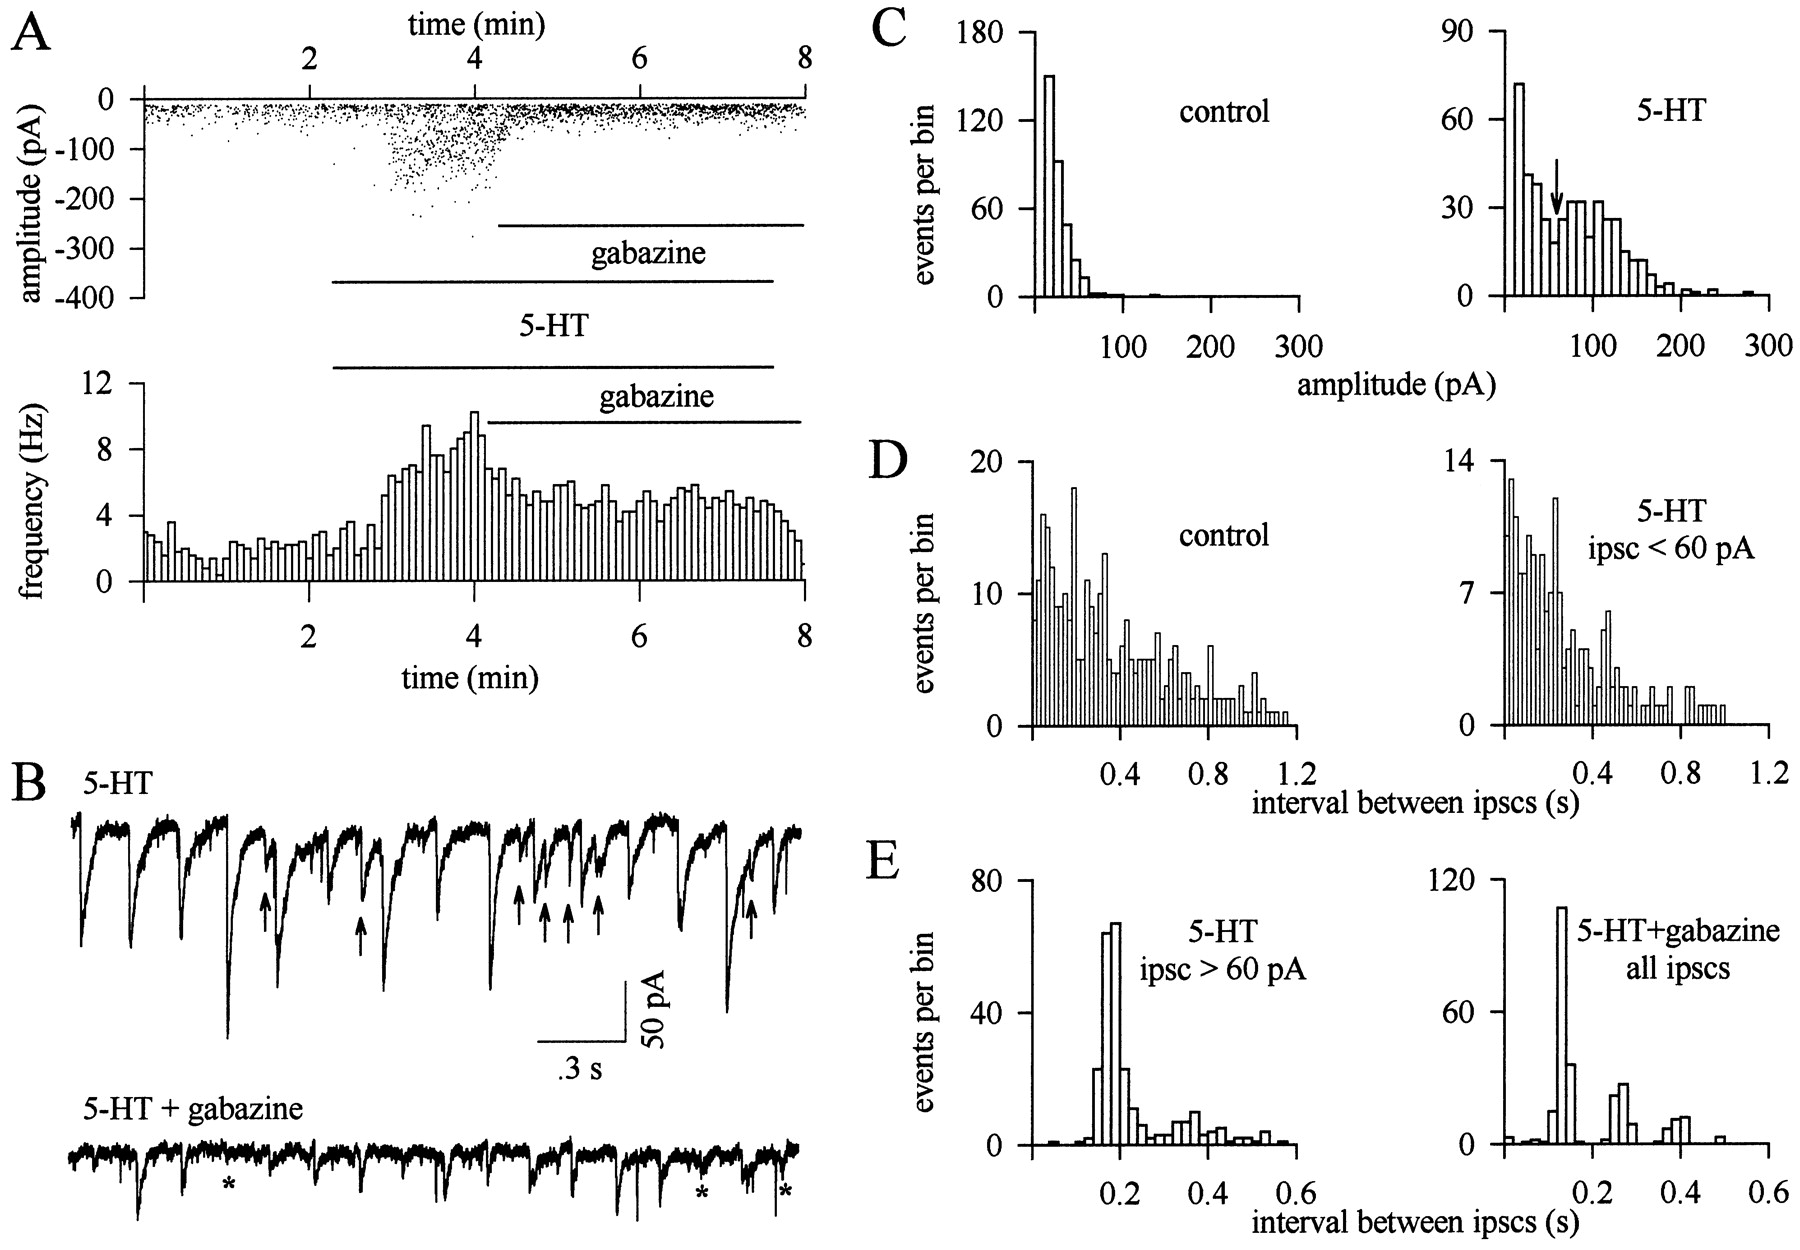
GABA and glycine are coreleased by single Lugaro cells onto Golgi cells. A, The effect of serotonin (1 μm) on the inhibitory synaptic activity recorded from a Golgi cell is summarized in the top plot, where each dot represents an IPSC. The mean frequency of IPSCs over bins of 5 sec is plotted at the same time scale in the bottom graph. Note the monophasic increase in the amplitude and frequency of the IPSCs after application of serotonin. Gabazine (30 μm) decreased both the amplitude and the frequency of the IPSCs in the presence of serotonin.B, Representative sections (2.5 sec) of recording taken before (top; 4 min time point in A) and after (bottom; 5 min time point in A) gabazine application are shown. In the presence of gabazine, IPSCs under the threshold of detection (10 pA) are indicated by anasterisk. C, Amplitude histograms of the IPSCs during the control period (left) and in the presence of 5-HT (right) are shown. D, Histograms show the distribution of the intervals between two successive events during the control period (left) and for the IPSCs <60 pA in the presence of serotonin (right). E, The same histograms for the IPSCs >60 pA in the presence of serotonin (left) and for all the IPSCs recorded after addition of gabazine (right) are shown.


