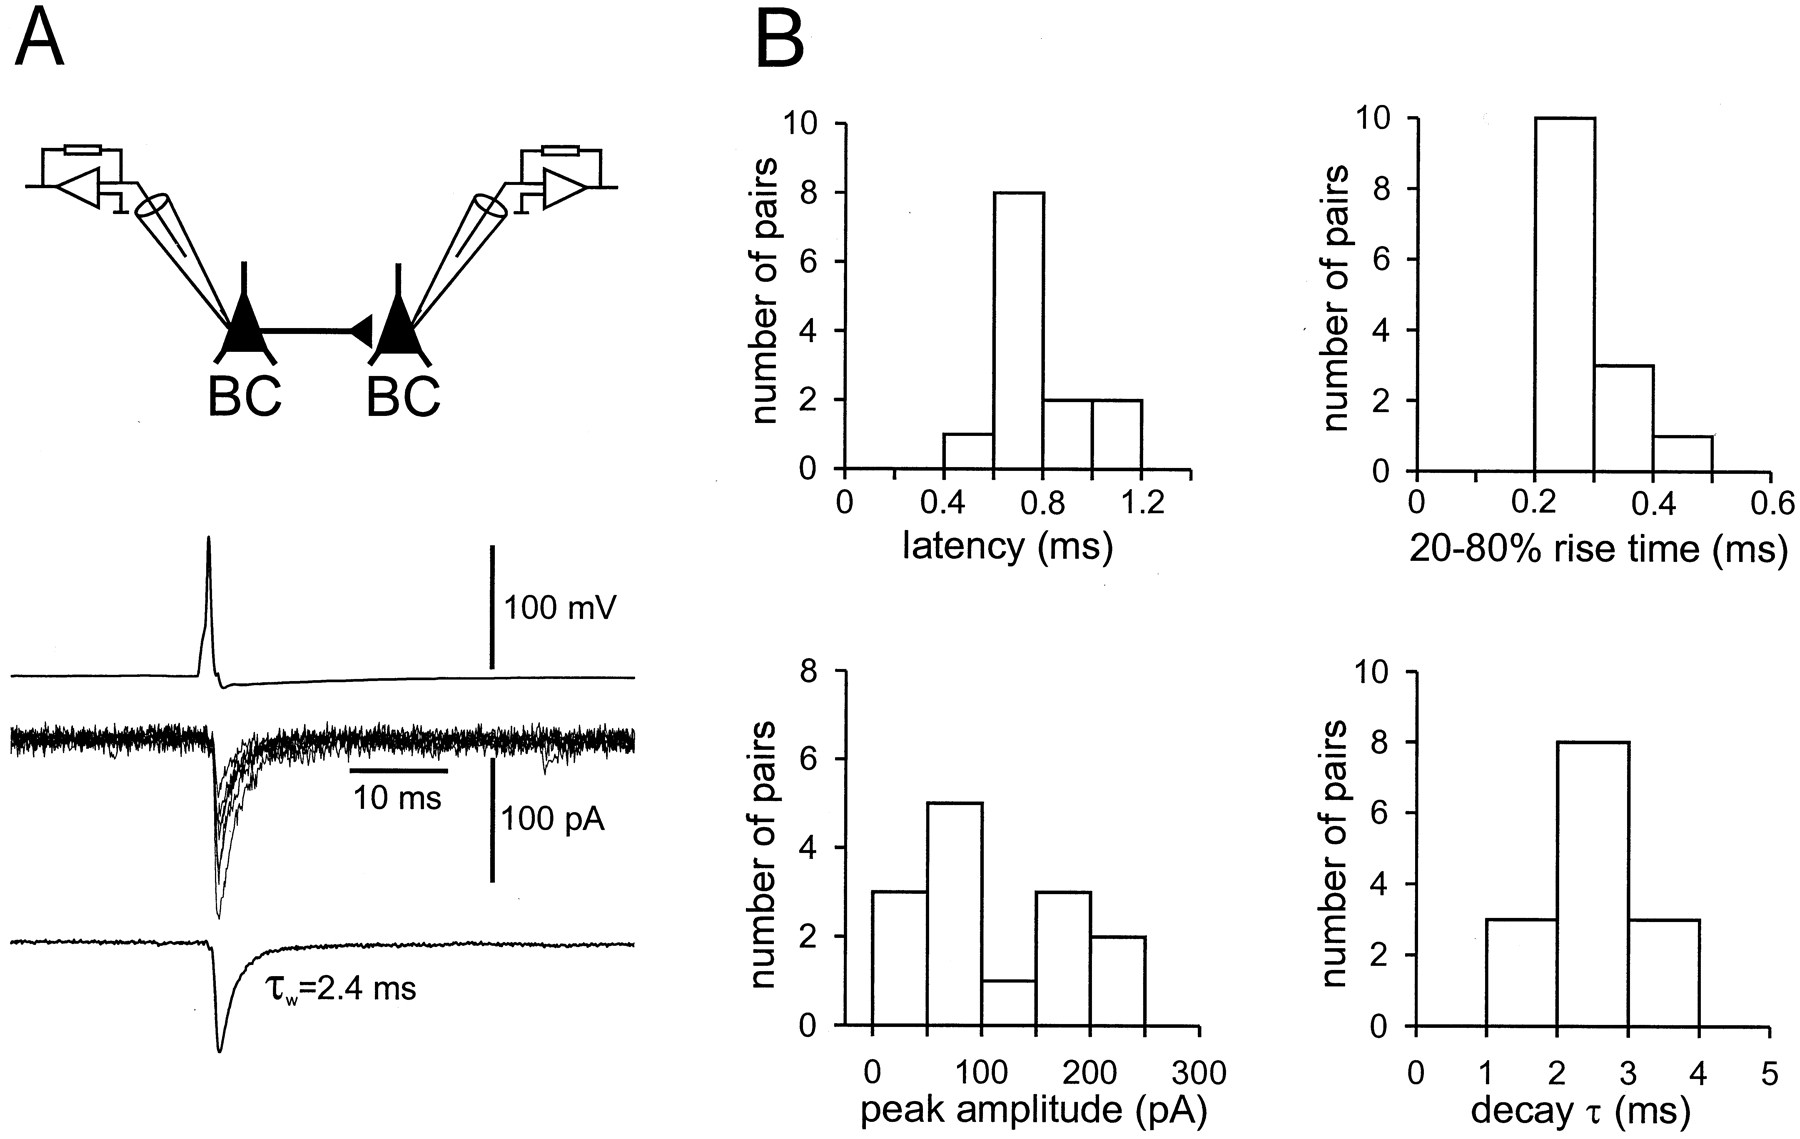
Fast unitary IPSCs in synaptically connected BC–BC pairs. A, Presynaptic action potential (top), single unitary IPSCs (6 sweeps superimposed,center), and average IPSC (from 38 sweeps,bottom) at −70 mV are depicted. The schematic illustration on top illustrates the recording configuration. B, Histograms of latencies, 20–80% rise times, peak amplitudes of average unitary IPSCs (including failures), and decay time constants [amplitude-weighted mean decay time constant τw (biexponential fit) in 11 pairs and τm(monoexponential fit) in 3 pairs]. Values of latencies, rise times, amplitudes, and decay time constants were determined from average IPSCs (including >10 individual traces). For latency measurements, one pair was excluded because of high presynaptic series resistance. Shown are summary graphs of data from 14 rigorously identified BC–BC pairs.


