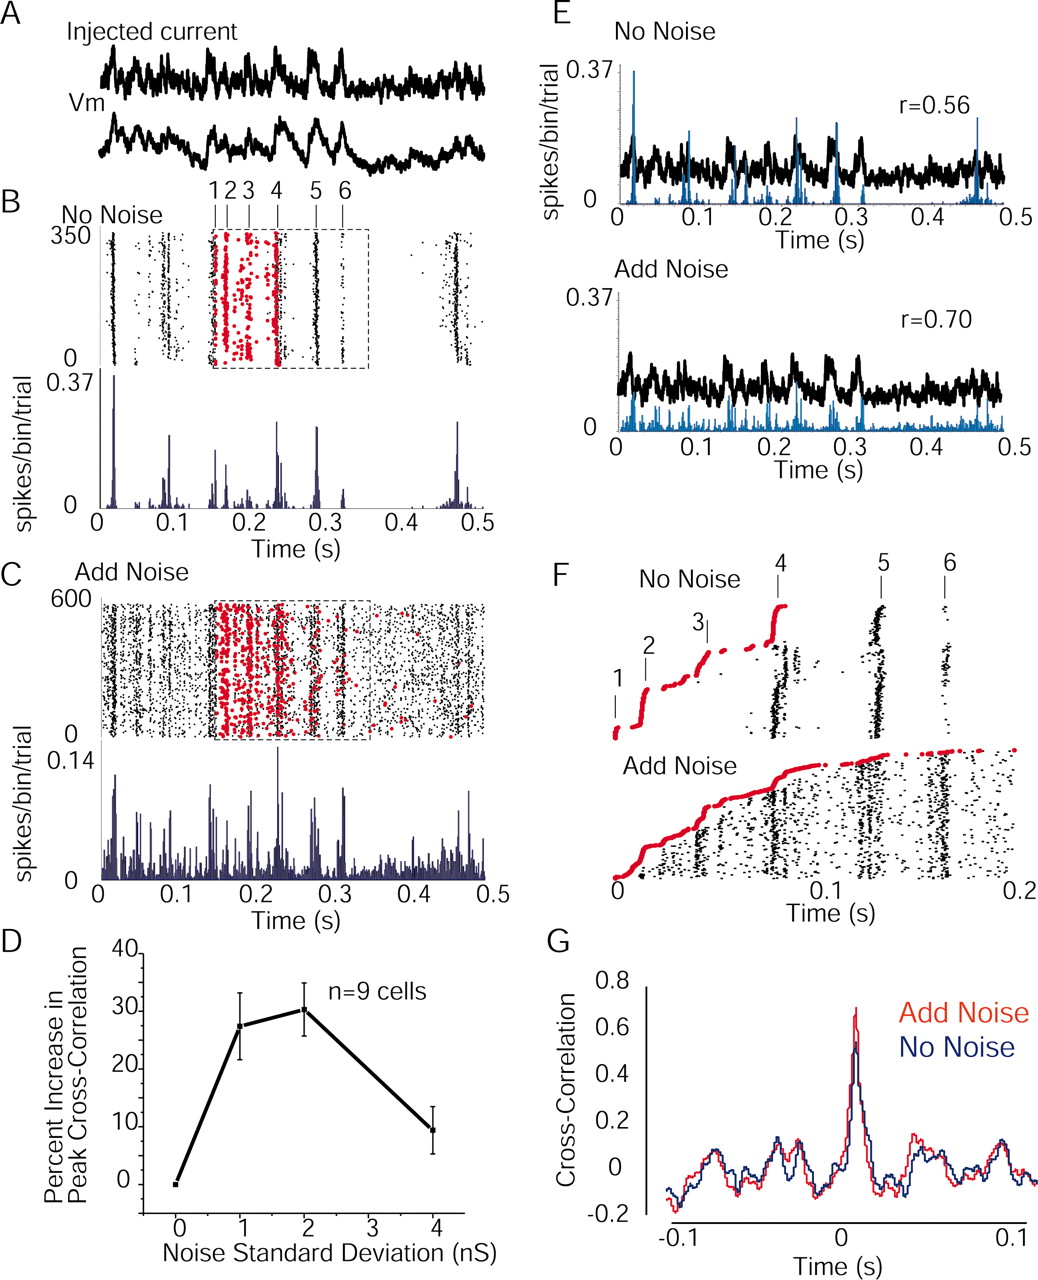
Increases in membrane variance can enhance the correlation between the spike response and the injected current waveform. A, Examples of injected current (derived from a visual response recorded in vivo) and the resulting membrane potential deviation in one neuron recorded in vitro. B, Raster plots of spike times over 375 trials in response to the injection of the current waveform in A during the DOWN period and without the addition of injected noise. Note the regularity of the spike response and the six peaks of activity within the box. Red dots are the first spikes to occur after the beginning of the examined period for each trial, as indicated by the dashed box. C, Same neuron as in B but with the addition of noise (2 nS SD). Note the appearance of spikes throughout the injected waveform. The scale is different for the histogram in C versus B. Again, red dots are the first spikes to occur on each trial after beginning of the indicated time period (dashed box). D, Group statistics showing that there is a significant increase in peak cross-correlation between the injected current and the spike histogram with the addition of 1 and 2 nS of added noise, but this effect is less with 4 nS of noise. E, Overlay of the injected current in A and the histograms in B and C plotted to the same scale. Note the increase in correlation between the waveform and the spike output after the addition of noise. F, Reordering of the spike data in B and C according to the time of the first spike (red dots) within the period examined (B, C, boxes). Note that without noise, the cell only discharges at peak 2 if it has not discharged to peak 1. Similarly, the cell only discharges to peak 3 if it has not discharged to peaks 1 or 2. If the cell discharges to peak 3, then the response to peak 4 is delayed. These results indicate that the generation of an action potential has a significant effect on the probability of generation of following spikes for ∼50-80 msec. The addition of background noise results in a reduction of this shadow effect, allowing the cell to discharge throughout the injected waveform. G, Examples of cross-correlations in the no noise and 2 nS noise conditions.


