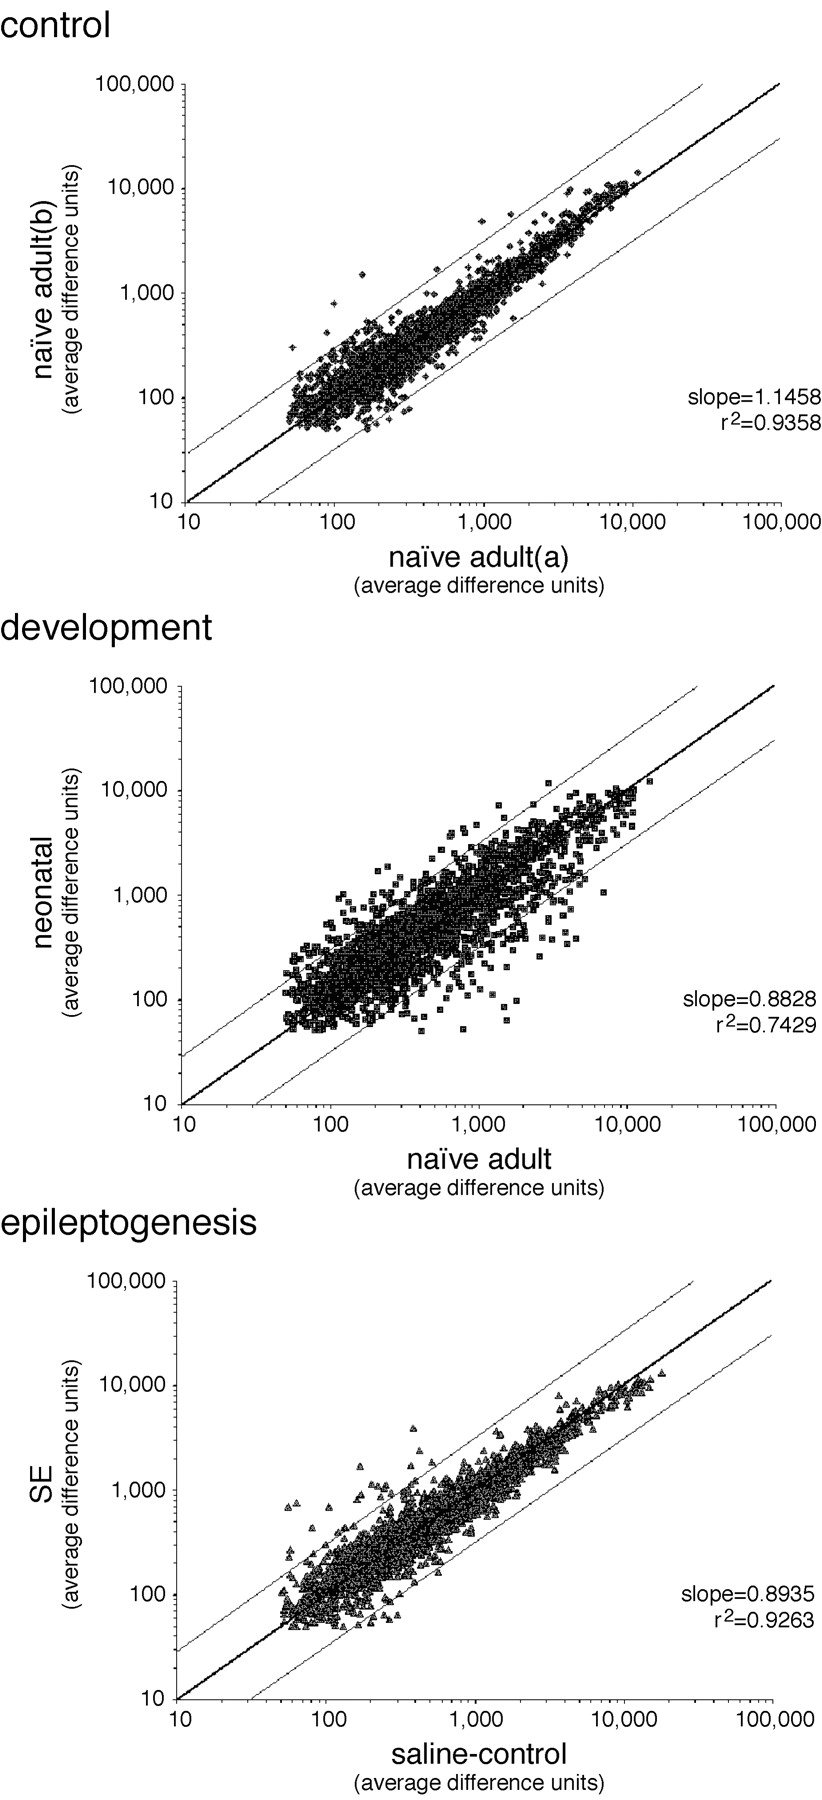
Scattergram analysis of microarray data. Average difference (AD) measures of gene expression for each of the 2680 detectable sequences on the microarray were plotted to yield scattergrams similar to the representative examples shown here. The high degree of correlation of AD values from two independent naive adult dentate gyrus cRNA samples reflects the accuracy of gene expression data derived from the DNA microarrays (top panel). Greater scattering in development and epileptogenesis samples is indicative of differential gene expression during those processes (middle and bottom panels). Light lines on either side of thedarker line of equality indicate twofold changes in mRNA levels.


