Fig. 12.
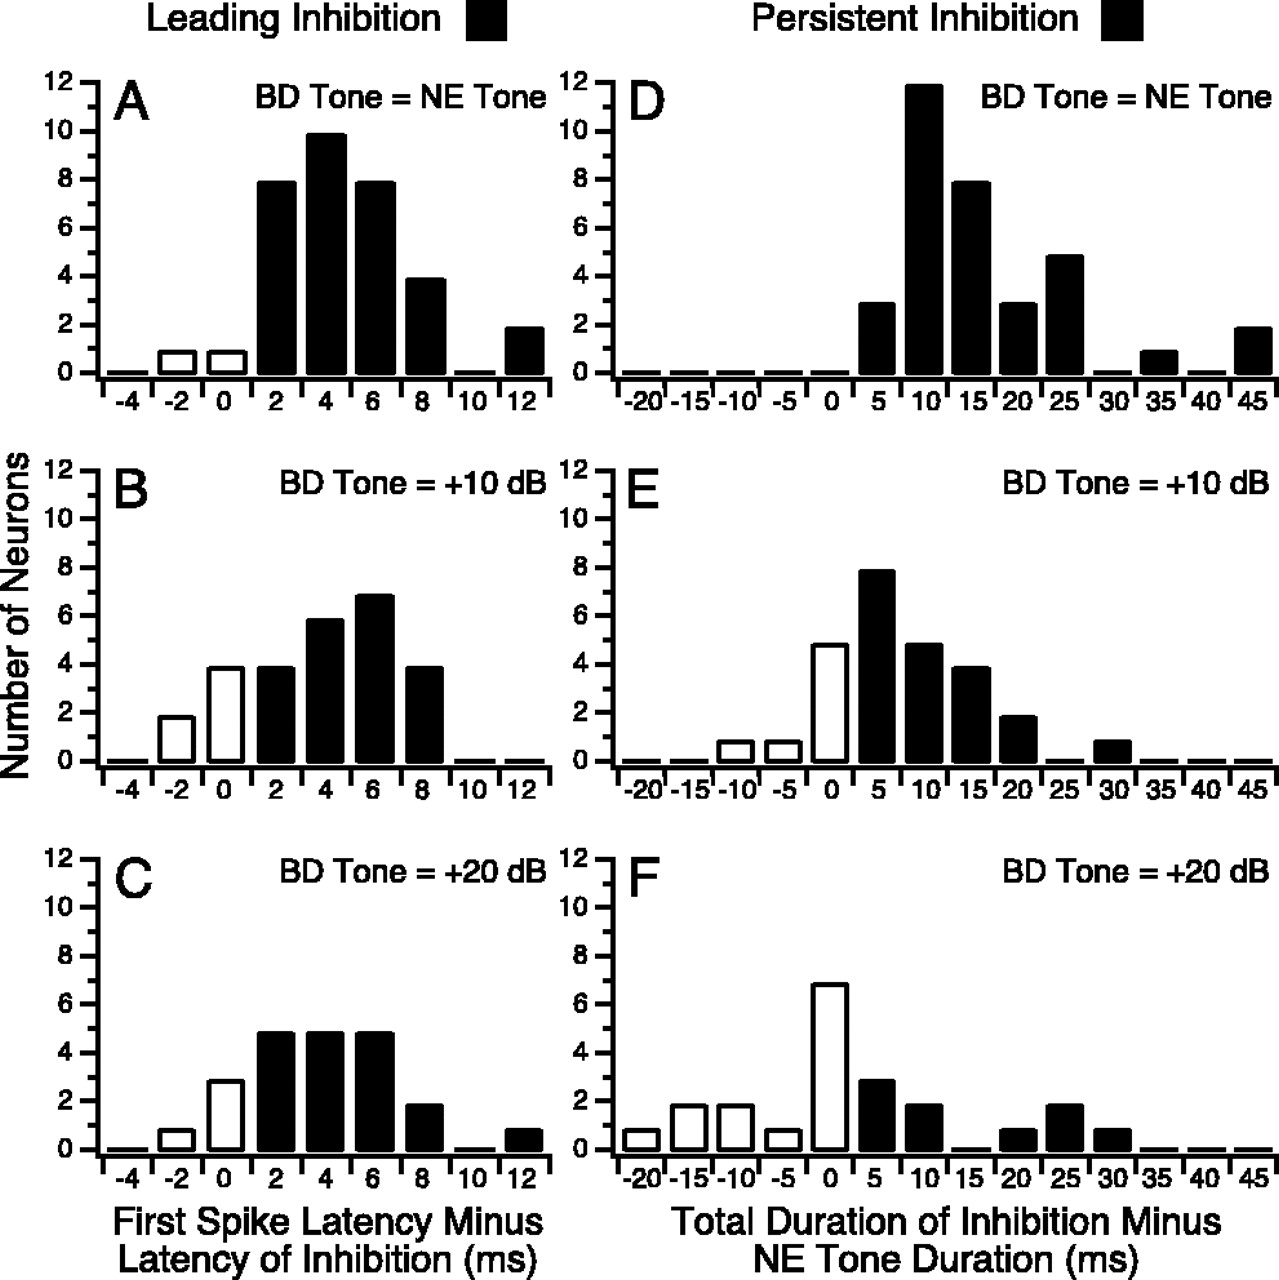
Leading and persistent inhibition at different relative amplitudes of the BD and NE tones. Left column,Distribution of the difference between first spike latency and the latency of the inhibition evoked by the NE tone. Right column, Distribution of the difference between the total duration of the inhibition evoked by the NE tone and the duration of the NE tone. The numbers of neurons with leading and persistent inhibition are shown with black bars. Increasing the amplitude of the BD tone had little effect on the number of neurons with leading inhibition (A–C), but the number of neurons with persistent inhibition decreased (D–F). A, D,n = 34; B, E, n= 27; C, F, n = 22.


