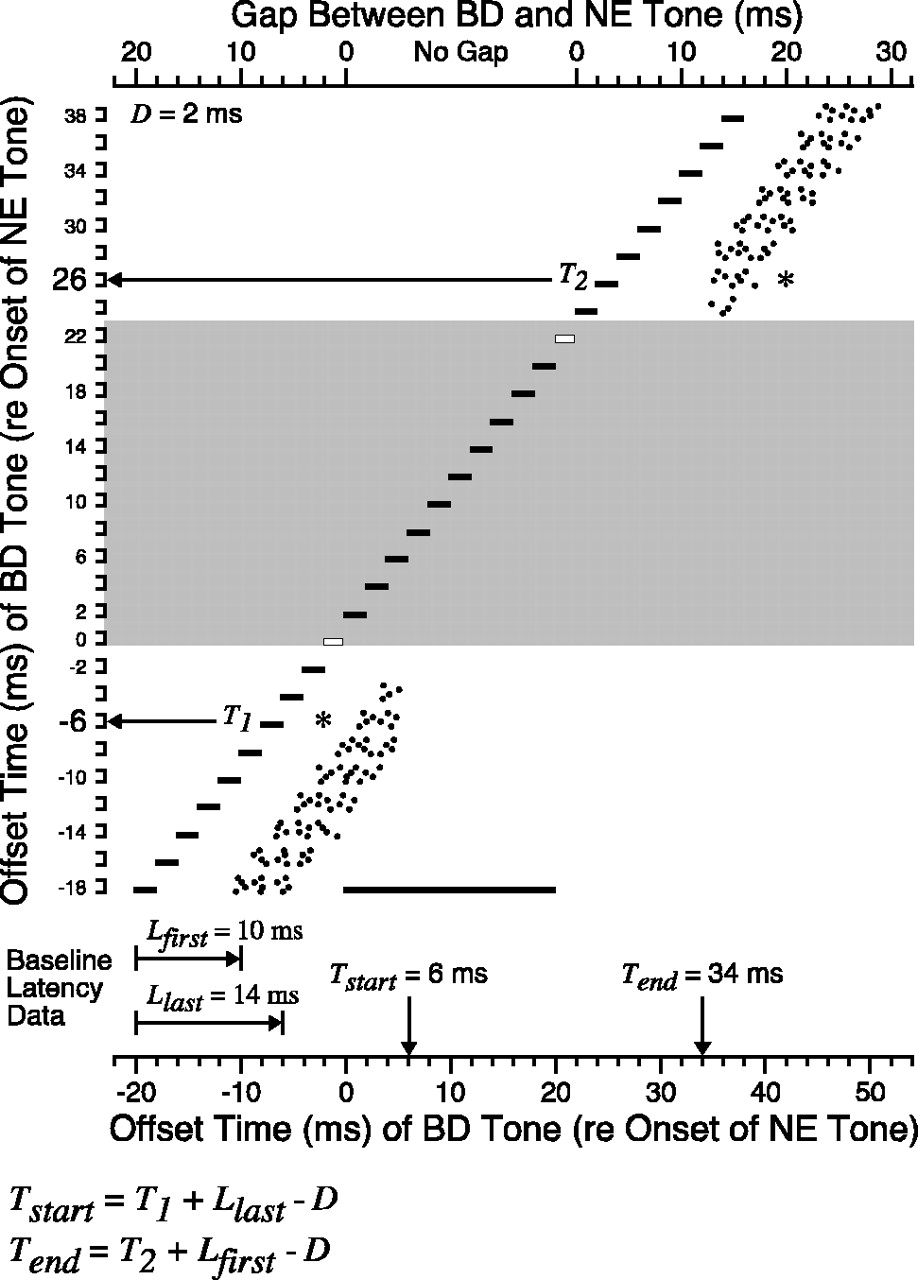
Measuring inhibition with paired tone stimulation. The schematic peristimulus rastergram (stacked dot display) shows how changes in the timing and number of action potentials (black dots) can be used to calculate the effective start (Tstart) and end (Tend) times of the inhibition evoked by the NE tone with the equations at the bottom. For this hypothetical cell, the average baseline first spike latency (Lfirst) is 10 msec, and the average baseline last spike latency (Llast) is 14 msec. The first time interval at which the mean last spike latency of the cell decreased by >1 SD belowLlast was T1= −6 msec (asterisk). The last time interval at which the mean first spike latency of the cell remained >1 SD aboveLfirst wasT2 = 26 msec (asterisk). The BD and NE tones are illustrated as black bars. BD bars with a white fill indicate two time intervals when the BD tone was contiguous with, but did not overlap, the NE tone. Thegray box indicates the range of times over which the BD tone was contiguous with or overlapped the BD tone to form a single composite stimulus with an amplitude increment (i.e., a pedestal). BD tone duration, D = 2 msec; NE tone duration, 20 msec.


