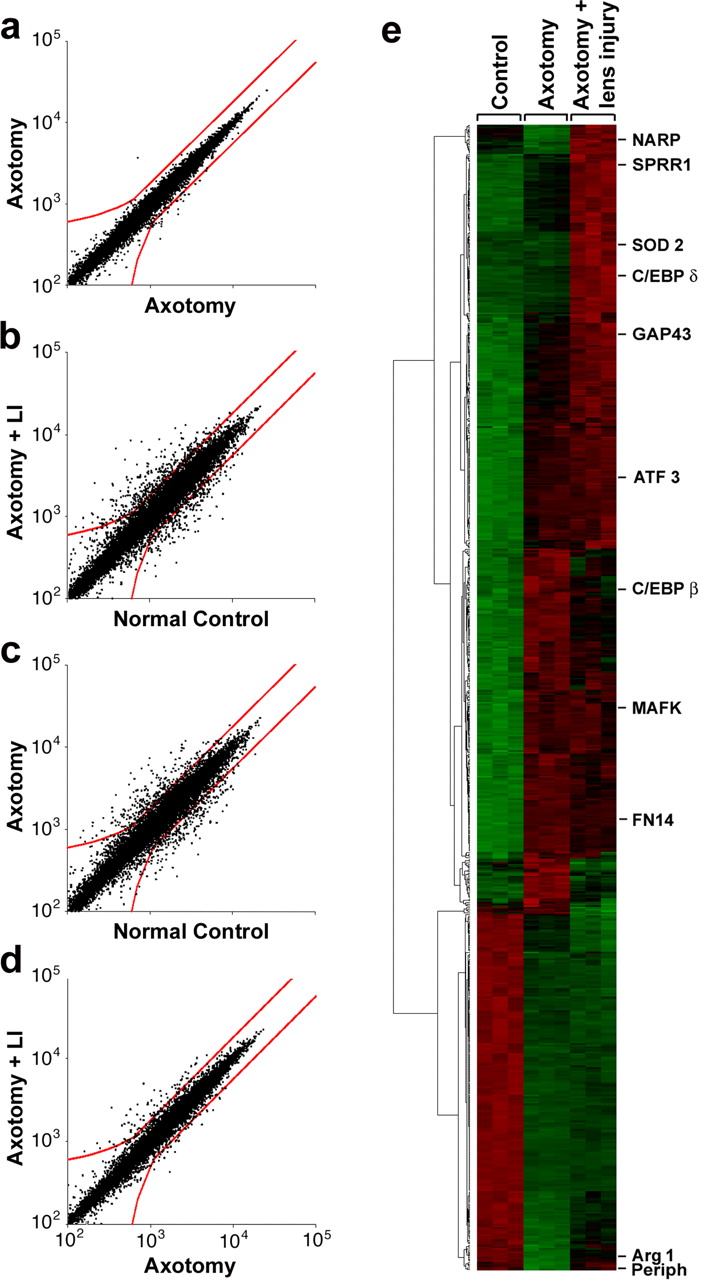
Microarray analysis of RGC gene expression. a-c, Cross-correlation of hybridization signals. Red lines bound points that fall below the criteria for significance. a, Control for reproducibility: hybridization signals for RGCs subjected to axotomy alone in two independent studies (correlation coefficient, 0.99). b, c, Hybridization signals for RGCs subjected to axotomy plus lens injury (b) or axotomy alone (c) compared with normal controls (correlation coefficient, 0.94 for both). d, Hybridization signals for RGCs subjected to axotomy plus lens injury versus axotomy alone (correlation coefficient, 0.98). e, Cluster diagram of gene expression changes from three independent experiments, each of which profiled mRNA levels for RGCs in the three conditions shown on top. Diagram includes 730 genes that change ≥1.8-fold between any two experimental conditions. Representative genes showing different patterns of changes are shown on far right.


