Short- and Long-Term Effects of Cholinergic Modulation on Gamma Oscillations and Response Synchronization in the Visual Cortex
Supplemental data
Files in this Data Supplement:
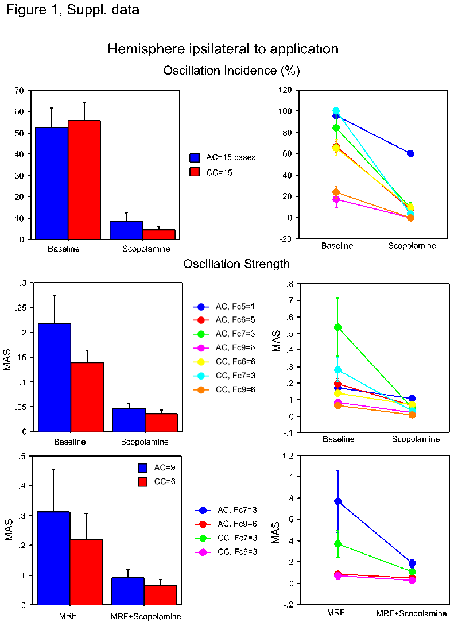
- supplemental material - Supplementary Data Figure 1. Cross-experiment variability of gamma-oscillation incidence (two upper plots) and strength (middle and lower plots) as measured from Auto-and Cross-Coincidence Histograms (ACs and CCs) as an effect of scopolamine injection without (middle plots) and with MRF stimulation (lower plots). The bar plots combine the results from AC and CC analyses as plotted in figure 1G of the manuscript. In addition we present the mean values (�1 s.e.m.) for baseline and scopolamine of all ACs and CCs from each experiment (line plots).
- supplemental material - Supplementary Data Figure 2. Cross-Experiment Variability of gamma-oscillation incidence (left column) and strength (right column) as measured from Auto- and Cross-Coincidence Histograms (ACs and CCs) as an effect of agonist injection. The upper two plots are copies of the two left plots of figure 2C in the manuscript. The closed and open circles represent measurements from auto- and cross-correlations, respectively. The lower two plots show the same data as mean values for the baseline and post-ejection period of all ACs and CCs from each experiment.
- supplemental material - Supplementary Data Figure 3. Strength (upper plot) and incidence (lower plot) of gamma-oscillations during a succession of two subsequent carbachol injections (red) and one atropine injection (magenta). Note that the strength of the visually-induced oscillations was on average increased by more than 50% by pairing with carbachol, while atropine applied some time later reduced the strength below baseline levels (compare purple to dark blue plots).


- Print ISSN: 0270-6474
- Online ISSN: 1529-2401
