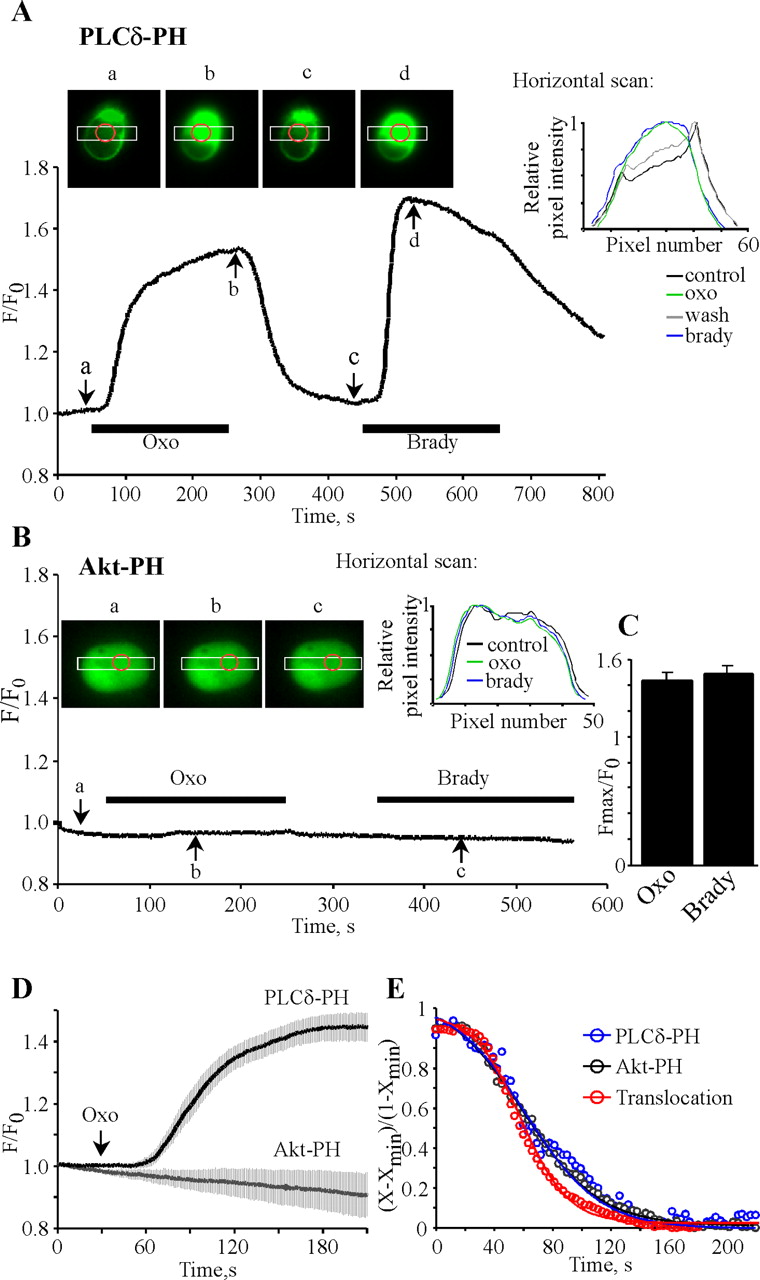
Translocation of membrane-localized PLCδ-PH to the cytosol reports PIP2 hydrolysis by muscarinic and bradykinin (brady) stimulation. Plotted are normalized cytosolic fluorescence of EGFP excited at 470 nm during oxotremorine (10 μm) and bradykinin (200 nm) application (indicated by the bars) for PLCδ-PH- (A) or Akt-PH- (B) transfected cells. Insets on the top depict images of the cells studied taken at the times indicated by the arrows. White boxes define areas where horizontal scans (insets on the right) were performed. Red circles indicate the “regions of interest” in the cytoplasm used for the F/Fo measurements. Exposures (50 msec, A; 200 msec, B) were acquired every 1 sec. The longer exposures in B led to slight accumulated photobleaching during the experiment. C, Bars summarize the normalized cytosolic fluorescence increase by muscarinic and bradykinin stimulation. D, Pooled data for PLCδ-PH- and Akt-PH-transfected cells (n = 7 and 5, respectively), temporarily aligned to the time of oxo application. E, Plotted are the data from Figure 4 D for muscarinic modulation in PLCδ-PH- and Akt-PH-expressing neurons, normalized to maximal effect and superimposed with the pooled PLCδ-PH translocation shown in D, inverted, and normalized to maximal effect. Data were fit by the equation as in Figure 4 D, but here, y represents current inhibition or translocation normalized for maximal effect {(X - Xmin)/(1 - Xmin)}. Data are shown without error bars for clarity.


