Neuronal Pentraxins Mediate Synaptic Refinement in the Developing Visual System
Supplemental data
Files in this Data Supplement:
- supplemental material - Supplemental Figure 1: Whole mount immuno-staining for NP1 in a P7 WT mouse retina indicates that NP proteins are evenly distributed across the ganglion cell layer. Scale=250μm
- supplemental material - Supplemental Figure 2: NP2 immunoreactivity in RGC axons within the optic nerve and dLGN. (A) NP2 immunoreactivity in RGC axons within the P5 optic nerve. RGC: ganglion cell layer; ON: optic nerve. Scale bar=100μm (B) NP2 immunoreactivity in the P7 dLGN (green). Asterisk indicates hippocampal staining for NP2, consistent with the known localization of NP2 at this age (P7). (C) Retinogeniculate projections from the contralateral eye are labeled with CTβ−Alexa 594 (red). Note that the density of each label closely matches the other and is highest in the lateral dLGN and optic tract. (D) Merged image of the CTβ and NP2 images shows a high degree of colocalization, Scale= Scale=250μm.
- supplemental material - Supplemental Figure 3: Normal laterality of RGC projections in NP KO mice. Left column: schematic diagram of the retrograde labeling procedure. P8 NP1/2 KO mice (n=10) were injected with a retrograde tracer into the rostrolateral portion of one SC (either a small crystal of DiI or 1ml of CTβ-Alexa 594). In WT mice, the ipsilateral retinofugal projection originates from RGCs located in the ventro-temporal retina (Pak et al., 2004). A retinal flatmount diagram is drawn with dorsal (D), ventral (V), nasal (N) and temporal (T) axis labeled. In WT mice, ipsilaterally projecting RGCs are situated in the ventrotemporal retina. In all 10 NP1/2 KO mice examined, the RGCs backfilled from the ipsilateral SC always resided in the correct portion of the retina. Three fields from different mice are shown in photomicrographs A-C (different color boxes in schematic correspond to the different cases shown in each panel). Scale=100μm. Note; back labeling from the dLGN was not possible due to leak of the tracer into the overlying ventricle.
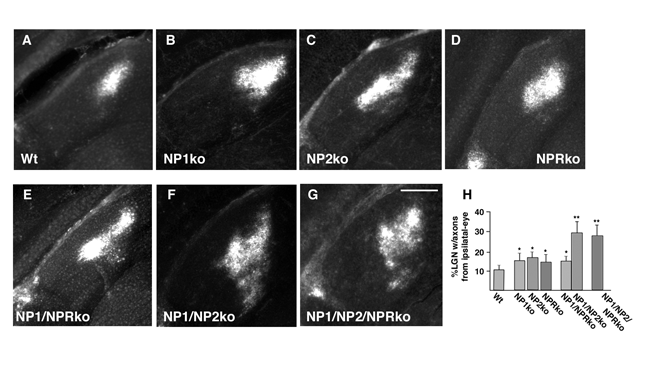
- supplemental material - Supplemental Figure 4: Comparison of the effects of single, double or triple knockout of NPs on refinement of ipsilateral eye retino-LGN projections. Ipsilateral eye projections to the dLGN of P10 (A)WT, (B) NP1 KO, (C) NP2 KO, (D) NPR KO, (E) NP1/NPR KO, (F) NP1/NP2 KO and (G) NP1/NP2/NPR KO mice. Scale=200 um. (H) Quantification of the percentage of the dLGN receiving axons from the ipsilateral eye in each condition. These values are derived from using a 30% above background threshold to designate signal from noise. The percentage of the dLGN receiving ipsilateral input is significantly greater in single KOs than wild type (P <_0.05 n="5).<!--" student="student" t="t" test.="test." this="this" is="is" also="also" significantly="significantly" greater="greater" for="for" np1="np1" npr="npr" double="double" kos="kos" p0.05="p0.05" np2="np2" p0.001="p0.001" and="and" triple="triple" end="end" desc="desc" suppfigure4.gif="suppfigure4.gif" _--="_--">
- supplemental material - Supplemental Figure 5: Mice lacking NP1 and NP2 exhibit normal hippocampal electrophysiology and plasticity. Basal synaptic function and LTP in NP1/NP2 double knockout and wild type mice. (A) Analysis of basal synaptic strength using input-output measurements. Graph plots field EPSP slope as a function of fiber volley amplitude. Inset shows example traces from wild type and double knockout slices (scale bars; 20 ms/ 0.5 mV). (N= 7 slices, 3 mice for both wildtype and NP1/NP2 KO mice) (B) Paired-pulse facilitation ratio plotted as a function of interstimulus intervals (ISIs) in wildtype (N=5 slices/3 mice) and NP1/NP2 double knockout (N=6 slice/3 mice) mice. Inset shows sample traces at varying interstimulus intervals (scale bars;100 ms/ 0.5 mV). (C) Comparison of the LTP induced in wild type (n=6 slices / 3 mice) and double knockout (n=7slices /3 mice) mice. LTP was induced at time=0 by a 100 Hz/1 sec tetanus given 4 times, 20 seconds apart. Sample traces were taken before (1) and 40 min after (2) the induction protocol (scale bars, 20 ms/0.5mV). (D) Comparison of the LTD induced in slices from WT (n=5 slices each from 3 mice) versus NP1/2 KO mice (n=5 slices each from 3 mice). Induction= 900 pulses at 3Hz (5 min total). Insets show sample traces taken before (1) and 40 min after (2) the induction protocol (scale bars 5ms/0.2mV).
- supplemental material - Supplemental Figure 6: Visual function in NP1/2 KO mice. (A) Electrophysiological signals recorded from the corneal surface to strobe stimuli presented under light-adapted conditions (top waveforms) or dark-adapted conditions (middle waveforms). The lower pair of waveforms was recorded from the scalp overlying the visual cortex. (B) Left: acquisition of an active avoidance task using a light cue. Right: performance of NP1/NP2 knockout and control mice as the intensity of the light cue was reduced by 1-4 log units by the addition of neutral density filters. Data points indicate the average (� s.d.) of 4 NP1/NP2 knockout mice and 5 control mice. (C-F) Intensity-response functions for the amplitude (C, E) and timing (D, F) of the major components of the dark-adapted (C, D) and light-adapted (E, F) ERG. Data points indicate the average (� S.E.M.) of 8 mice.
- supplemental material - Supplemental Figure 7: Normal clustering of AMPA receptors in hippocampal neurons. (A) Wild type hippocampal neurons stained for extracellular exposure of GluR1. (B) NP1/NP2 KO hippocampal neuron stained for extracellular exposure of GluR1. (C) Quantification of extracellular GluR1 cluster and extracellular GluR1-clusters opposite SV2 staining (synaptic vesicle marker) in wild type, NP1/NP2 double KO and NP1/NP2/NPR triple KO hippocampal neurons.




- Print ISSN: 0270-6474
- Online ISSN: 1529-2401
