Distinct cis-Regulatory Elements from the Dlx1/Dlx2 Locus Mark Different Progenitor Cell Populations in the Ganglionic Eminences and Different Subtypes of Adult Cortical Interneurons
Supplemental Data
Files in this Data Supplement:
- supplemental material - Supplementary information: Sequence. Multiple sequence alignment of URE2 in five vertebrate species: M, mouse; H, human; T, Takifugu rubripes; S, Spheroides nephelus; and Z, Zebrafish. The consensus sequence represents identity in five out of five species. Sequences similar to the binding site for Dlx proteins (A/C/GTAATTG/AC/G) (Feledy et al., 1999) are highlighted in grey. TAAT/ATTA putative homeodomain binding motifs are underlined.
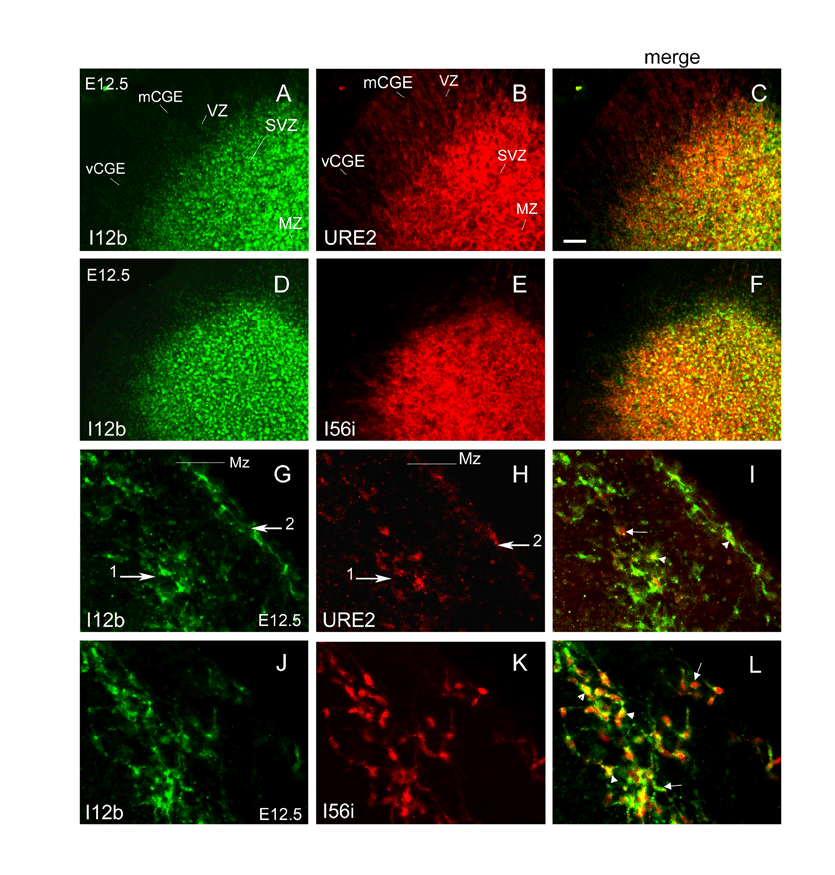
- supplemental material - Supplementary Figure S1. Activities of three Dlx CREs in the CGE and in the cortex near the CSB at E12.5. (A-F) Double immunohistochemistry showing (A, D) the expression of I12b-AP in green; (B) URE2-lacZ; (E) I56i-lacZ in red. (C, F) are merged pictures of (A, B), and, (D, E), respectively. URE2-lacZ expression is absent from the VZ and weaker in the SVZ of the vCGE compared with the mCGE. (G-L) Labeling of tangentially migrating cells at the level of the CSB at E12.5 in (G, J) I12b-AP, green, (H) URE2-lacZ, red and (K) I56i-lacZ, red, mouse embryos. (I, L) are merged pictures of (G, H) and (J, K), respectively. Similar to the MGE, migratory cells follow two streams of migrations at this age (H, I, K and L), and (H) there are few tangential migrating cells that express URE2-lacZ. Single-labeled and double-labeled cells are indicated with arrows and arrowheads, respectively. Scale bar = 25 �m in A-F and 12.5 �m in G-L. Symbols are the same as in Fig. 2 of the print version.
- supplemental material - Supplementary Figure S2. Activities of three Dlx CREs in tangentially migrating cells derived from the CGE at E13.5. (A-F) Double immunohistochemistry showing (A, D) the expression of I12b-AP, green; (B) URE2-lacZ, red; (E) I56i-lacZ, red, in the DP. (C, F) are merged pictures of (A, B) and (D, E), respectively. (G-L) Tangentially migrating cells follow the Mz and IZ of the DP at E13.5. (G-L) Higher magnification pictures of the boxes shown in (A-F), respectively. Panels (I, L) are merged pictures of (G and H), and, (J and K), respectively. As seen in the MGE, there are more migrating cells derived from the CGE that express URE2-lacZ at this age (B, H) compared with E12.5 (Fig. S1H). Most migrating cells in I12b-AP/I56i-lacZ double transgenic mice are double labeled (arrowheads in L) whereas a large number of cells in I12b-AP/URE2-lacZ mice are single-labeled (arrows in I). Single-labeled and double-labeled cells in I and L are indicated with arrows and arrowheads, respectively. Scale bar = 25 �m in A-F and 12.5 �m in G-L. Symbols are the same as in Fig. 2 of the print version.
- supplemental material - Supplementary Figure S3. Cell migrations from ventral structures to the DP at E12.5. (A, E) DiI labeling on coronal sections at medial levels. The location of the DiI crystal is indicated with an arrow. Labeled structures are indicated at the bottom of each section. Insets in A and E are pictures taken after 72h in culture. (B, F) are fluorescent pictures of (A, E) taken after 72h in culture, respectively. Higher magnifications of the left and right hemispheres in panels (B) and (F) are shown in (C, G) and (D, H), respectively. Little or no tangential migration towards the cortex is observed from progenitors in (C, H) the AEP; and (G) the POA. (D) Strong tangential migrations take place from the MGE. Scale bar = 100 �m in A, B, E, F and 40 �m in C, D, G, H. Symbols are the same as in Fig. 2 of the print version.
- supplemental material - Supplementary Figure S4. Cell migrations from ventral structures to the DP at E13.5. (A, E, I, M) DiI labeling on coronal sections at medial levels. The location of the DiI crystal is indicated with an arrow. Labeled structures are indicated at the bottom of each section. Insets in (A, E, I, M) are pictures taken after 48h in culture. (B, F, J, N) are fluorescent pictures of (A, E, I, M) taken after 48h in culture, respectively. Higher magnifications of the left and right hemispheres in panels (B, F, J, N) are shown in (C, G, K, O) and (D, H, L, P), respectively. Robust tangential migration of cells to the DP are observed in sections where (O) the dMGE; and (C, G, H) the vMGE are labeled. Little or no tangential migration is derived from progenitors in (D, K, P) the AEP; and (L) the POA. Scale bar = 100 �m in A, B, E, F, I, J, M, N and 40 �m in C, D, G, H, K, L, O, P. Symbols are the same as in Fig. 2 of the print version.
- supplemental material - Supplementary Figure S5: Co-expression of the neuropeptide Y (NPY) and nitric oxide synthase enzyme (nNOS) interneuron markers with URE2-lacZ, I12b-lacZ, and I56i-lacZ in the mouse adult somatosensory cortex at P35. Cells expressing (A-D, M-P) URE2-lacZ, (E-H, Q-T) I12b-lacZ, or (I-L, U-X) I56i-lacZ are shown in red. Interneurons-expressing (A-L) NPY or (M-X) nNOS are shown in green; (D, H, L, P, T, X) are higher magnifications of boxes shown in (C, G, K, O, S, W), respectively. (C, D, O, P) Most NPY+ and nNOS+ neurons express URE2-lacZ. A large number of NPY+ neurons but only a few nNOS+ neurons express the I12b-lacZ and I56i-lacZ transgenes. Double and single-labeled interneurons are indicated with arrows and arrowheads, respectively. Scale bar = 25 �m in (A-C, E-G, I-K, M-O, Q-S, U-W and 8.7 �m in (D, H, L, P, T, X).
- supplemental material - Supplementary Figure S6: Co-expression of the URE2-lacZ or I12b-lacZ transgene with a pan-Dll (anti-Dlx) antibody in the LGE at E13.5. (A-F) Double immunohistochemistry showing the expression of (A, D) a pan-Dll marker in green; and, URE2-lacZ (B) or I12b-lacZ (E) in red. (C, F) are merged pictures of (A, B), and, (D, E), respectively. Scale bar =10 �m.


- Print ISSN: 0270-6474
- Online ISSN: 1529-2401
