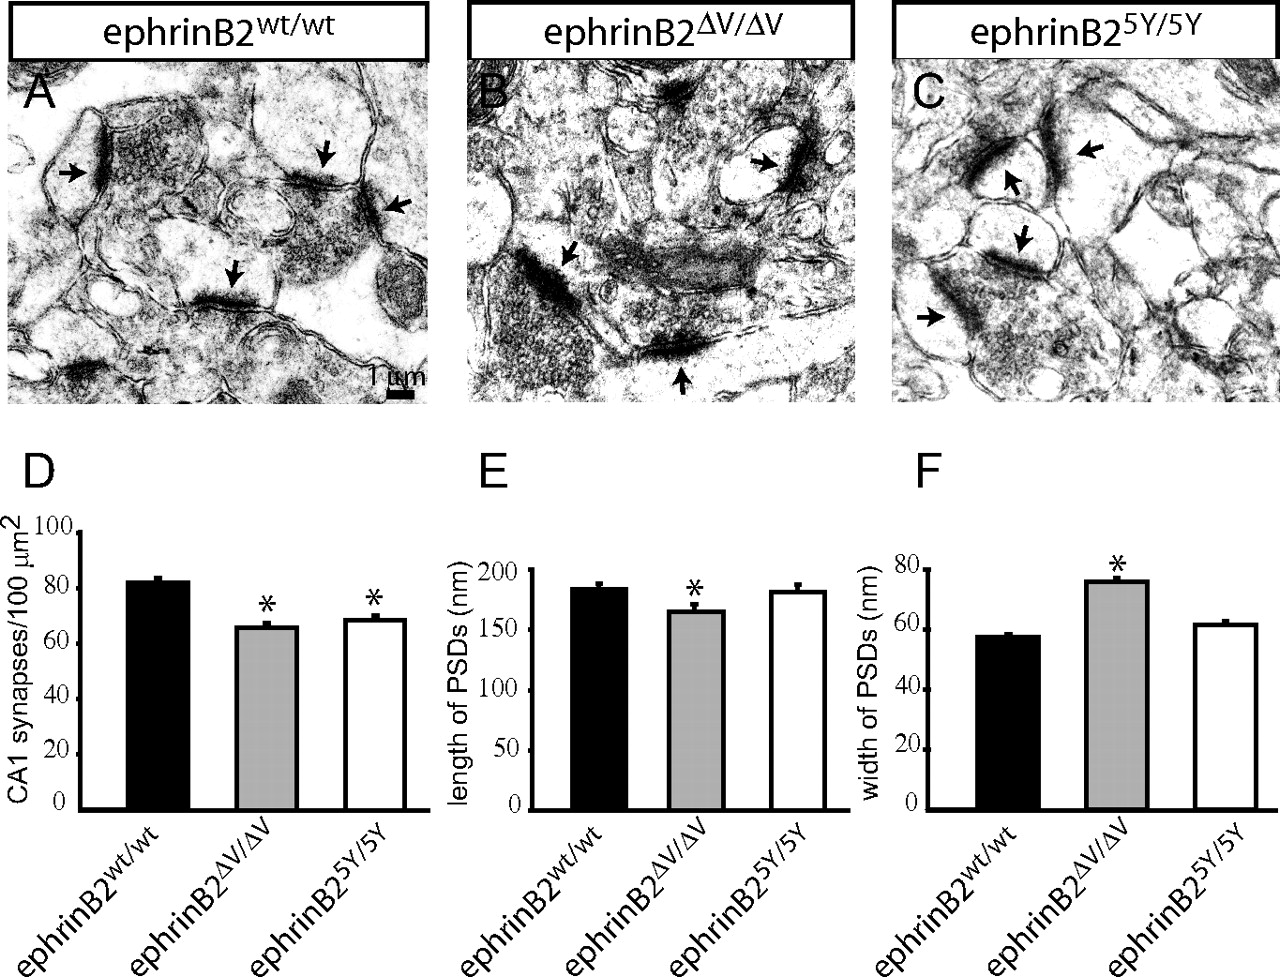
Morphologies of synapses derived from ephrinB2 mutant mice. A–C, Electron micrographs showing the morphology of asymmetric synapses in the CA1 region of the hippocampus of the indicated mice. PSDs are indicated by arrows. D, Numbers of synapses per 100 μm2 in the CA1 region (n = 3 mice per genotype; >2000 synapses per animal counted) of 2-month-old mice. Note a small but significant reduction in ephrinB25Y/5Y and ephrinB2ΔV/ΔV mice compared with ephrinB2WT/WT controls (*p < 0.01). E, Quantification of PSD length. Note a small but significant reduction in ephrinB2ΔV/ΔV mice compared with ephrinB2WT/WT controls (*p < 0.01) and no changes in ephrinB25Y/5Y mice. F, Quantification of PSD width. Note a small but significant increase in ephrinB2ΔV/ΔV mice compared with ephrinB2WT/WT controls (*p < 0.01) and no changes in ephrinB25Y/5Y mice. Error bars indicate SEM.


