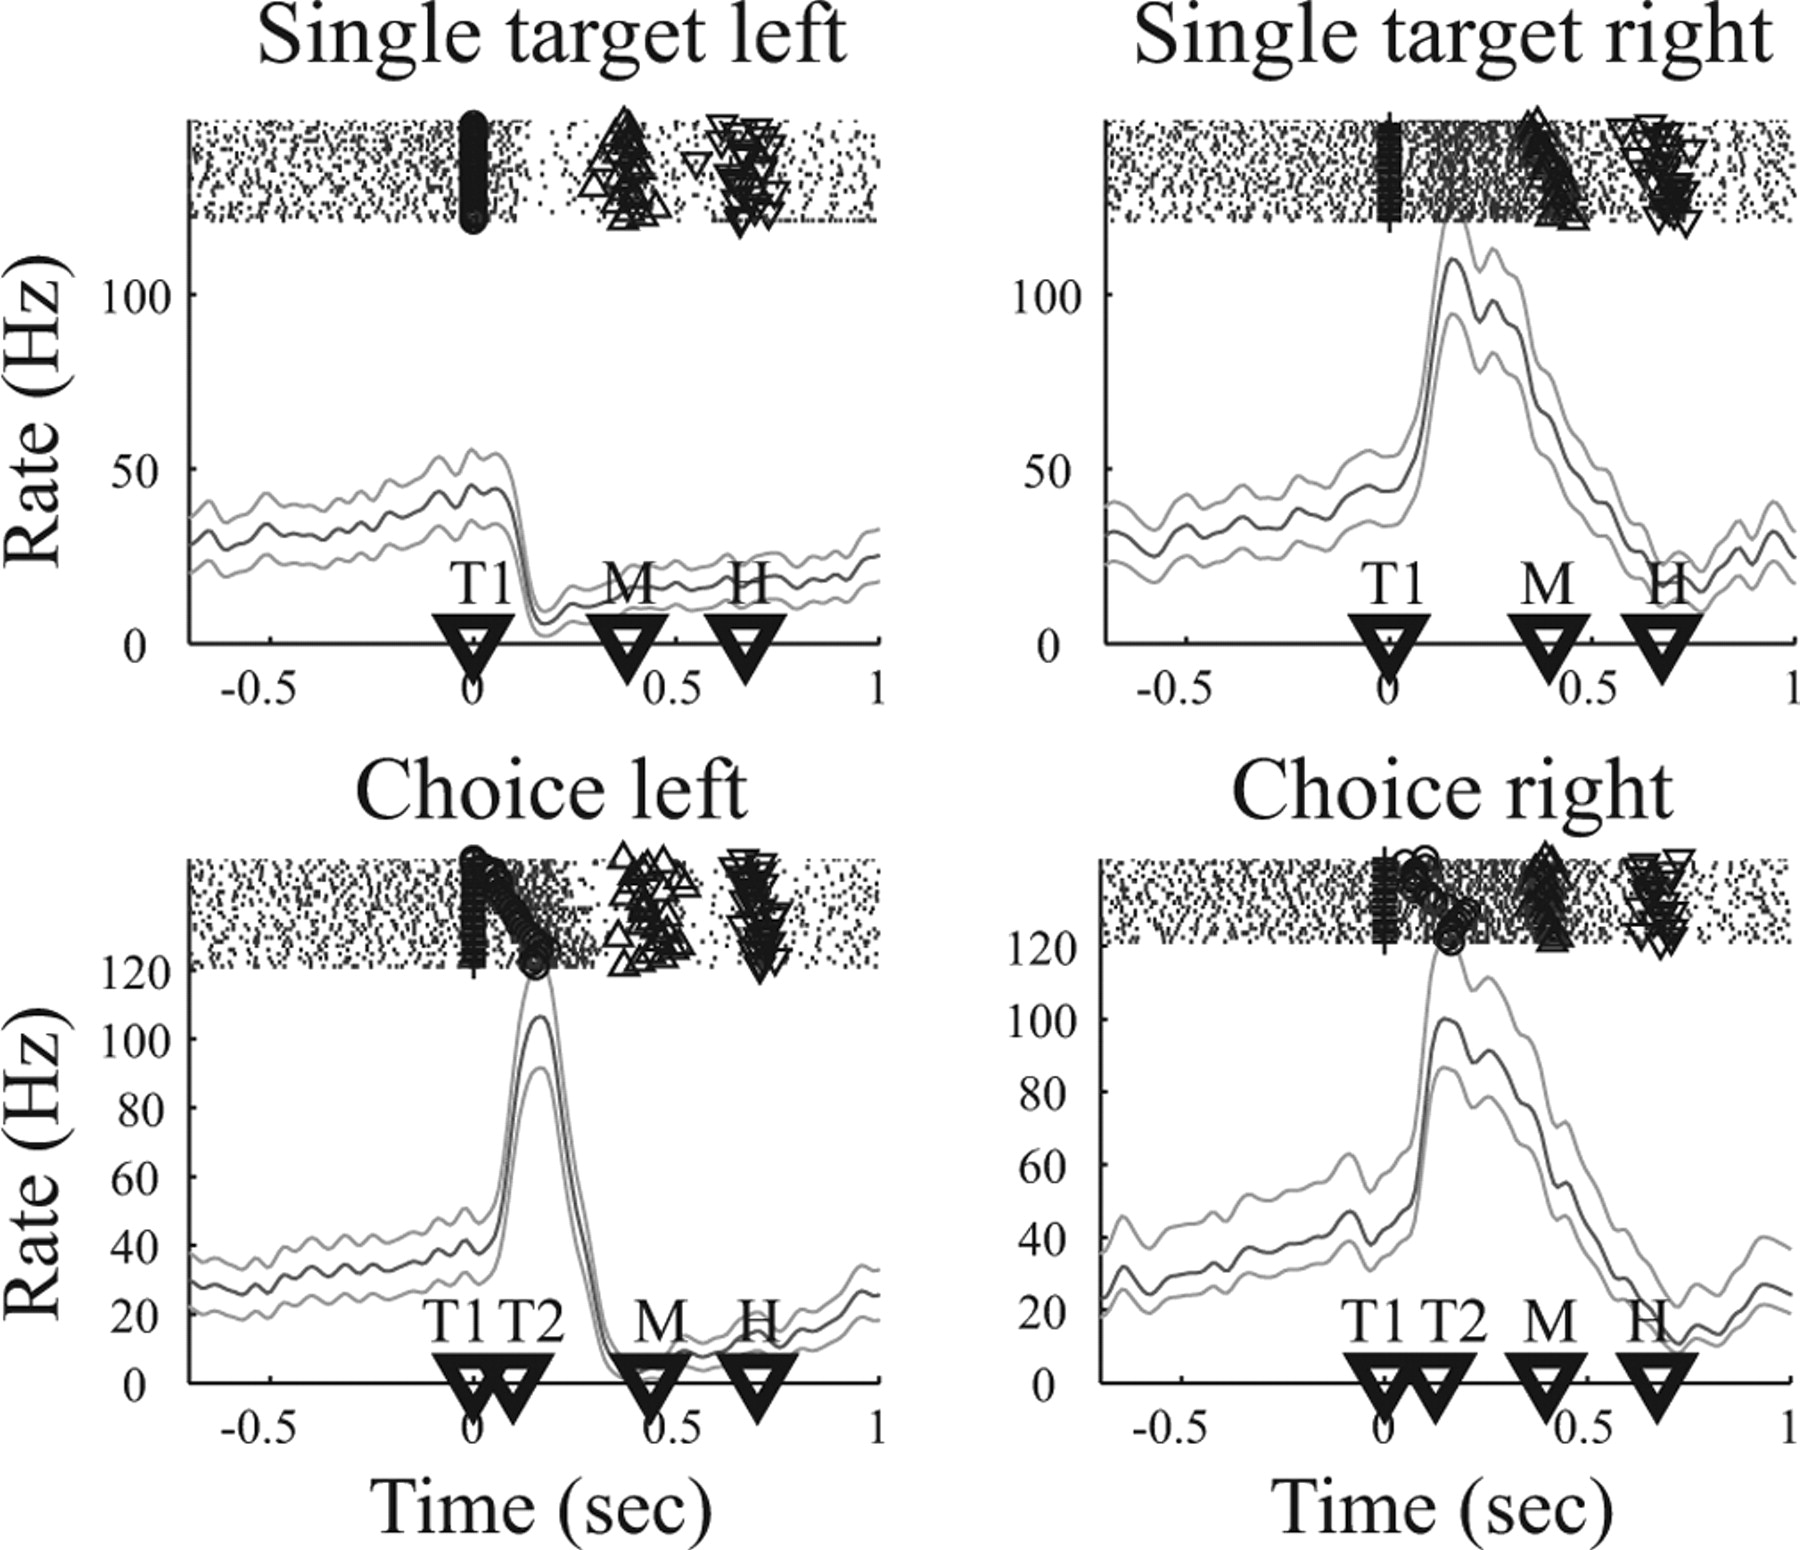
Example neuron during target selection for arm reaching. Top row shows neural activity for single target trials to the left or right, and bottom row shows the neural activity during choice trials, in which the animal either selected the left (left panel) or right (right panel) target. Each panel shows spike rasters at the top, with rows of dots indicating action potentials in subsequent trials. For individual trials, symbols indicate the appearance of left (○) and right (+) target and the beginning (Δ) and end (∇) of the movement. Below, the peristimulus time histogram is presented (mean rate and 95% confidence area). Time markers on the abscissa indicate the mean appearance of the first (T1) and second (T2) target and the beginning (M) and end (H) of the movement. Trials are aligned on the appearance of T1.


