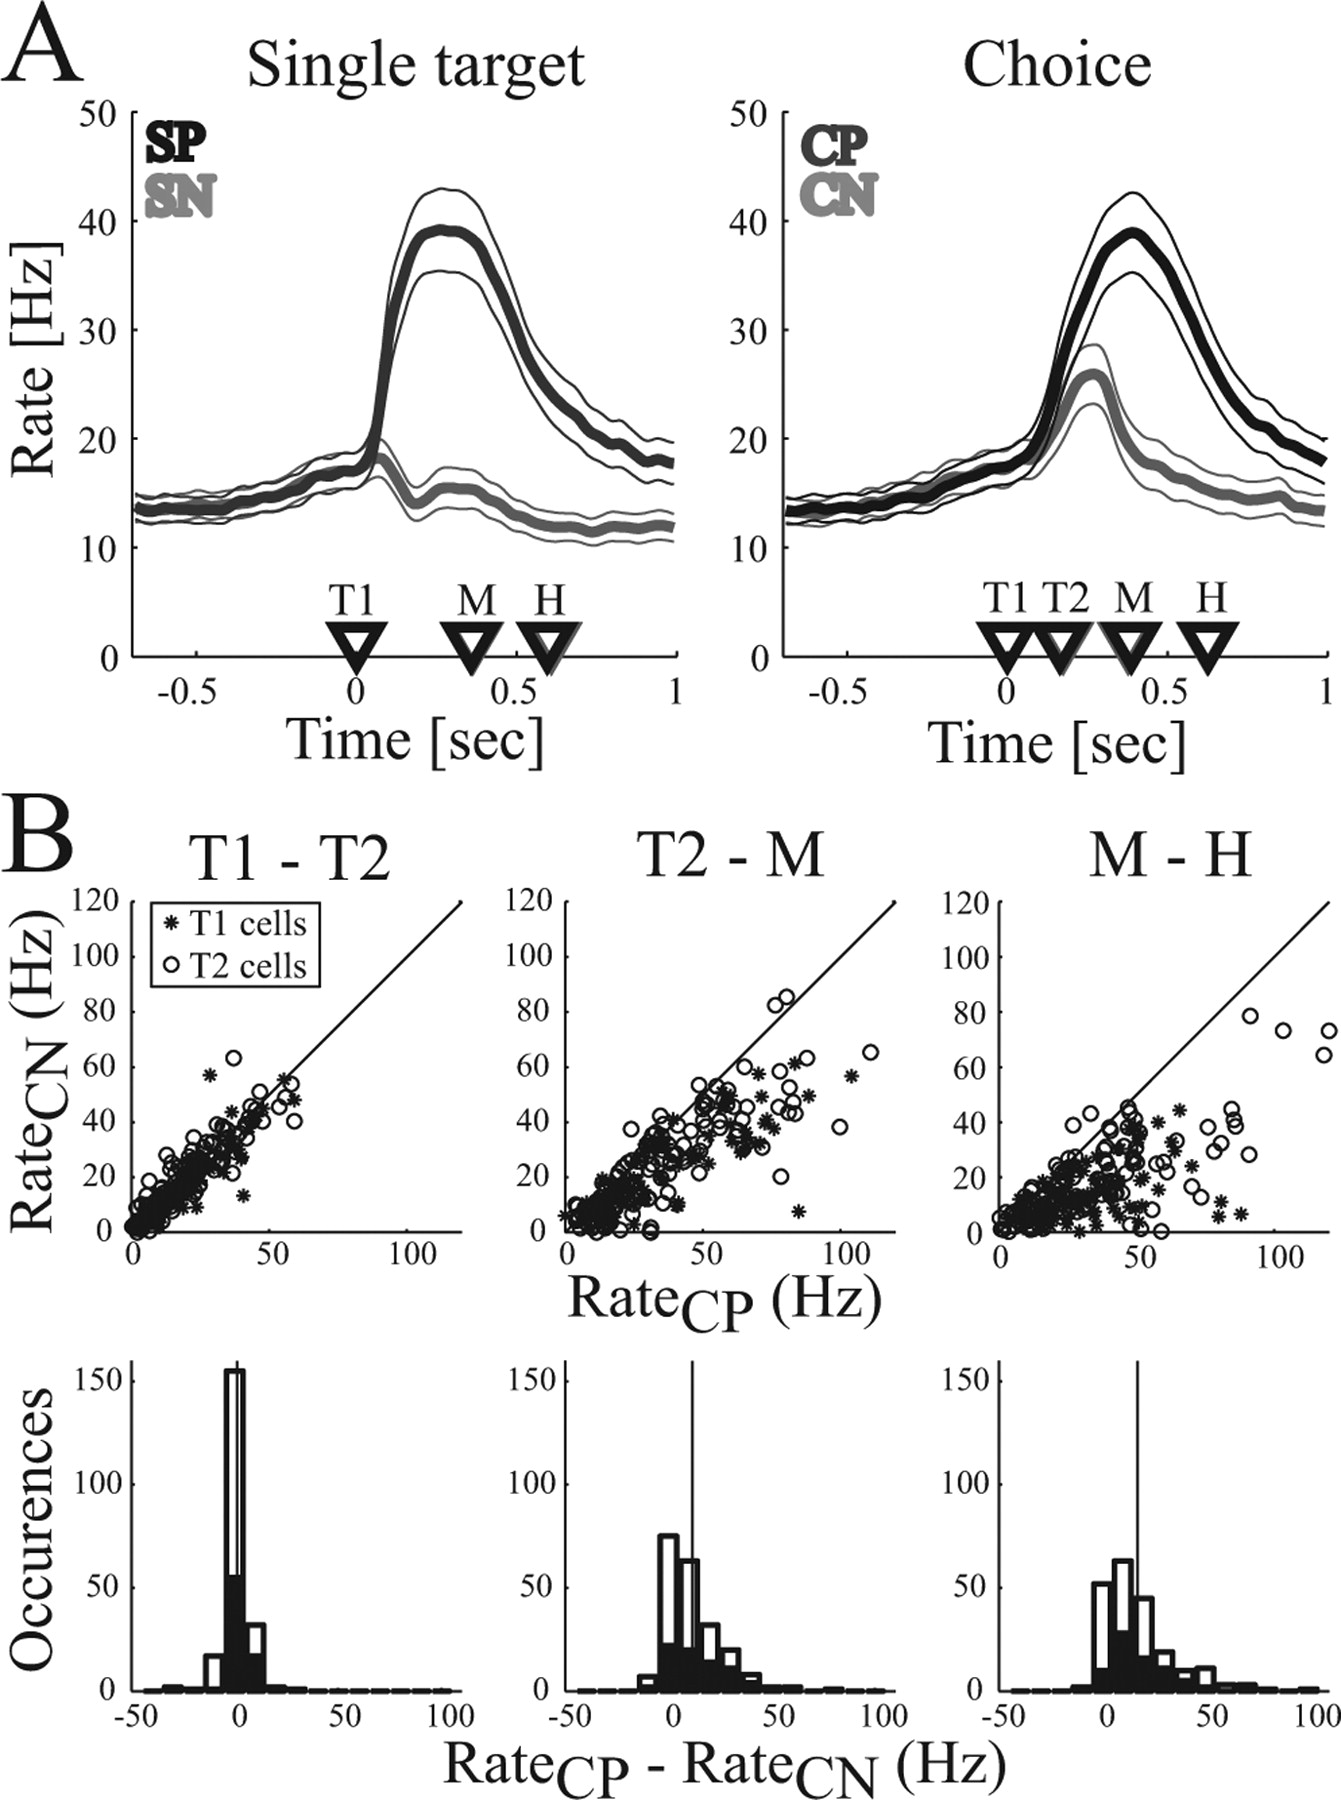
Population activity for reaching. A, Average firing rate in the single-target (left) and the choice task (right). Curves indicate the mean firing rate (and 95% confidence interval) for movements to the preferred (dark curve) and nonpreferred (light curve) target. Time markers indicate the mean appearance of the first (T1) and second (T2) target and the beginning (M) and end (H) of the movement. Trials are aligned on T1. B, Comparison of firing rates of individual neurons for choices of the preferred (CP) and nonpreferred (CN) targets in the time intervals T1–T2, T2–M, and M–H. Data points represent the neural activity of T1- and T2-selective cells in each of the three reach conditions: FP of 0, −16, and 16°. Top row, Scatter plots; Bottom row, Histograms of the activity difference between CP and CN (black bars, T1 cells; white bars, T2 cells). Vertical line indicates the mean.


