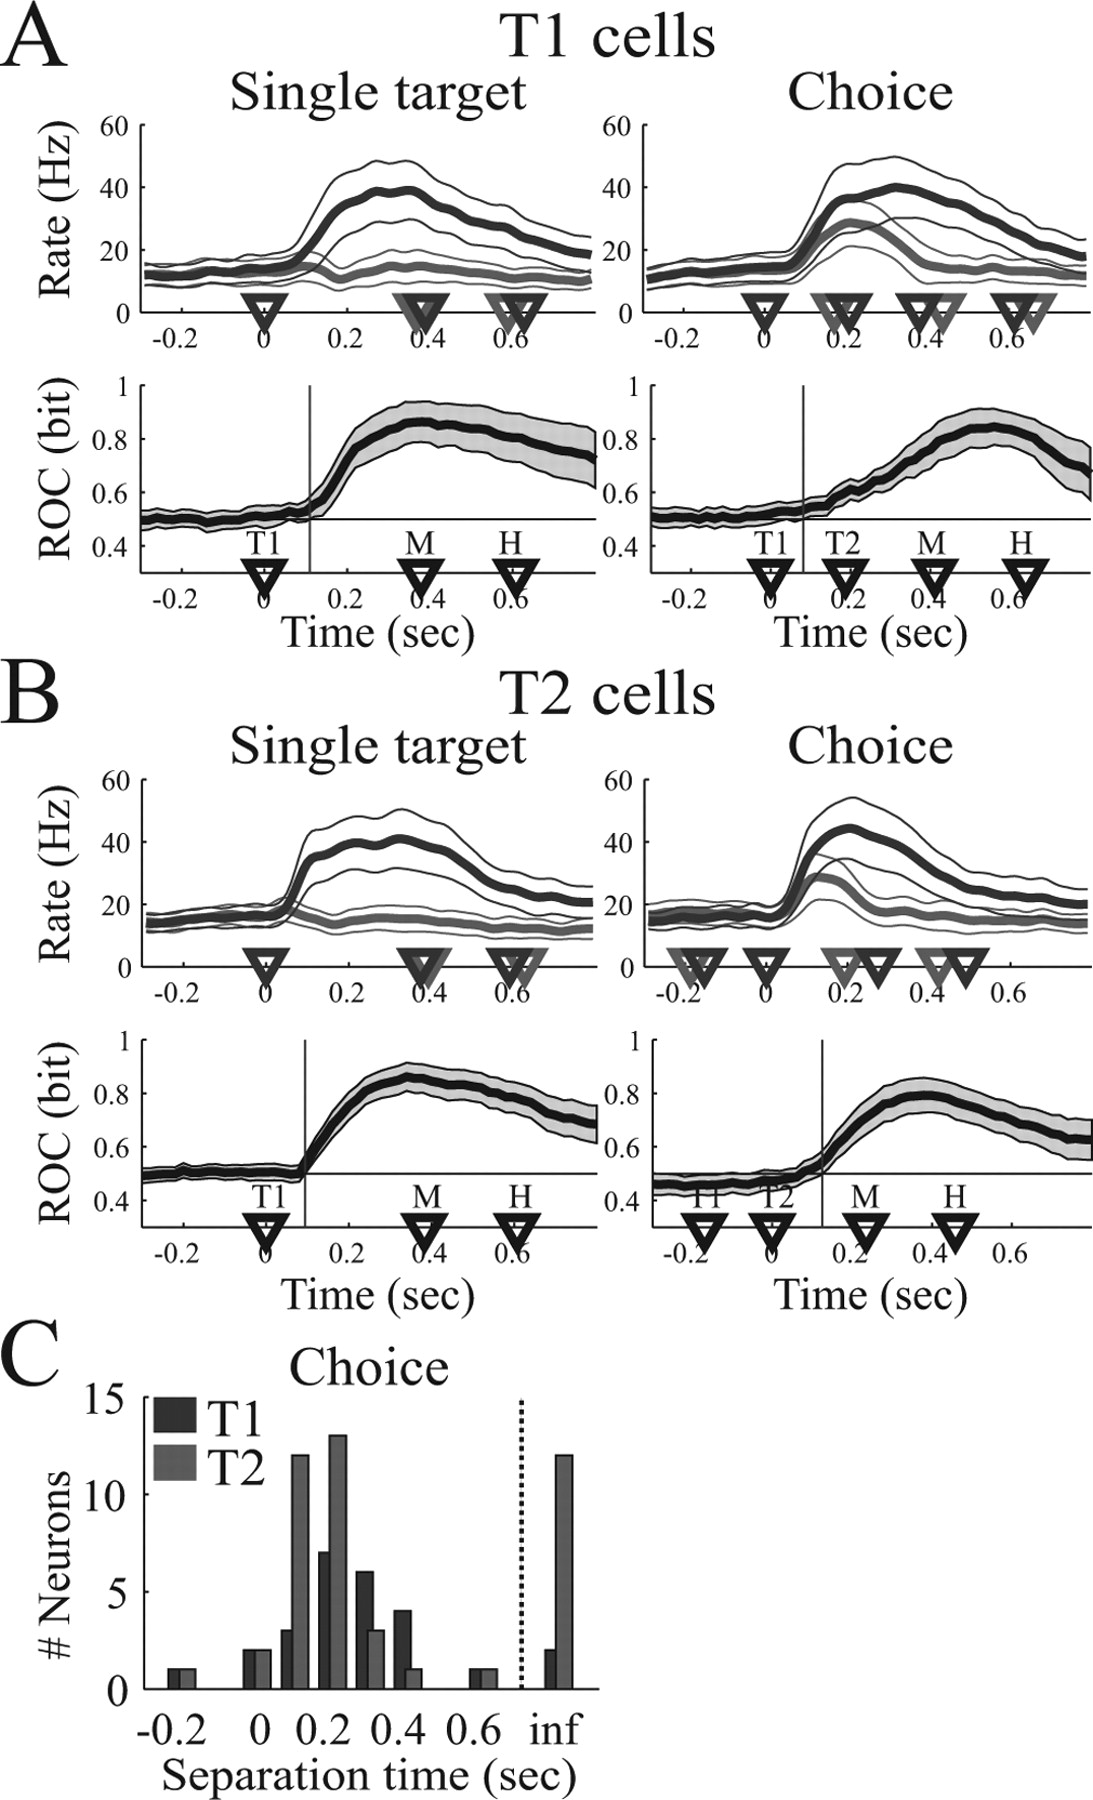
Temporal evolution of choice activity. A, Analysis of T1 cells (n = 26). B, Analysis of T2 cells (n = 45). In A and B, the top row shows the mean firing rate (and 95% confidence limit) in the single-target task (left side) and the choice task (right side) for reach movements to the preferred (dark curve) and nonpreferred (light curve) target. Bottom row shows the mean ROC predictability (thick curve) and 95% confidence limit (gray area). Vertical line, Time when mean ROC curve significantly exceeds chance (p < 0.05). Choice trials are aligned on T1 for T1 cells and on T2 for T2 cells. C, Histogram of separation time of T1 cells (dark bars) and T2 cells (light bars). inf, ts = ∞. Separation times are presented relative to alignment (T1 for T1 cells, T2 for T2 cells).


