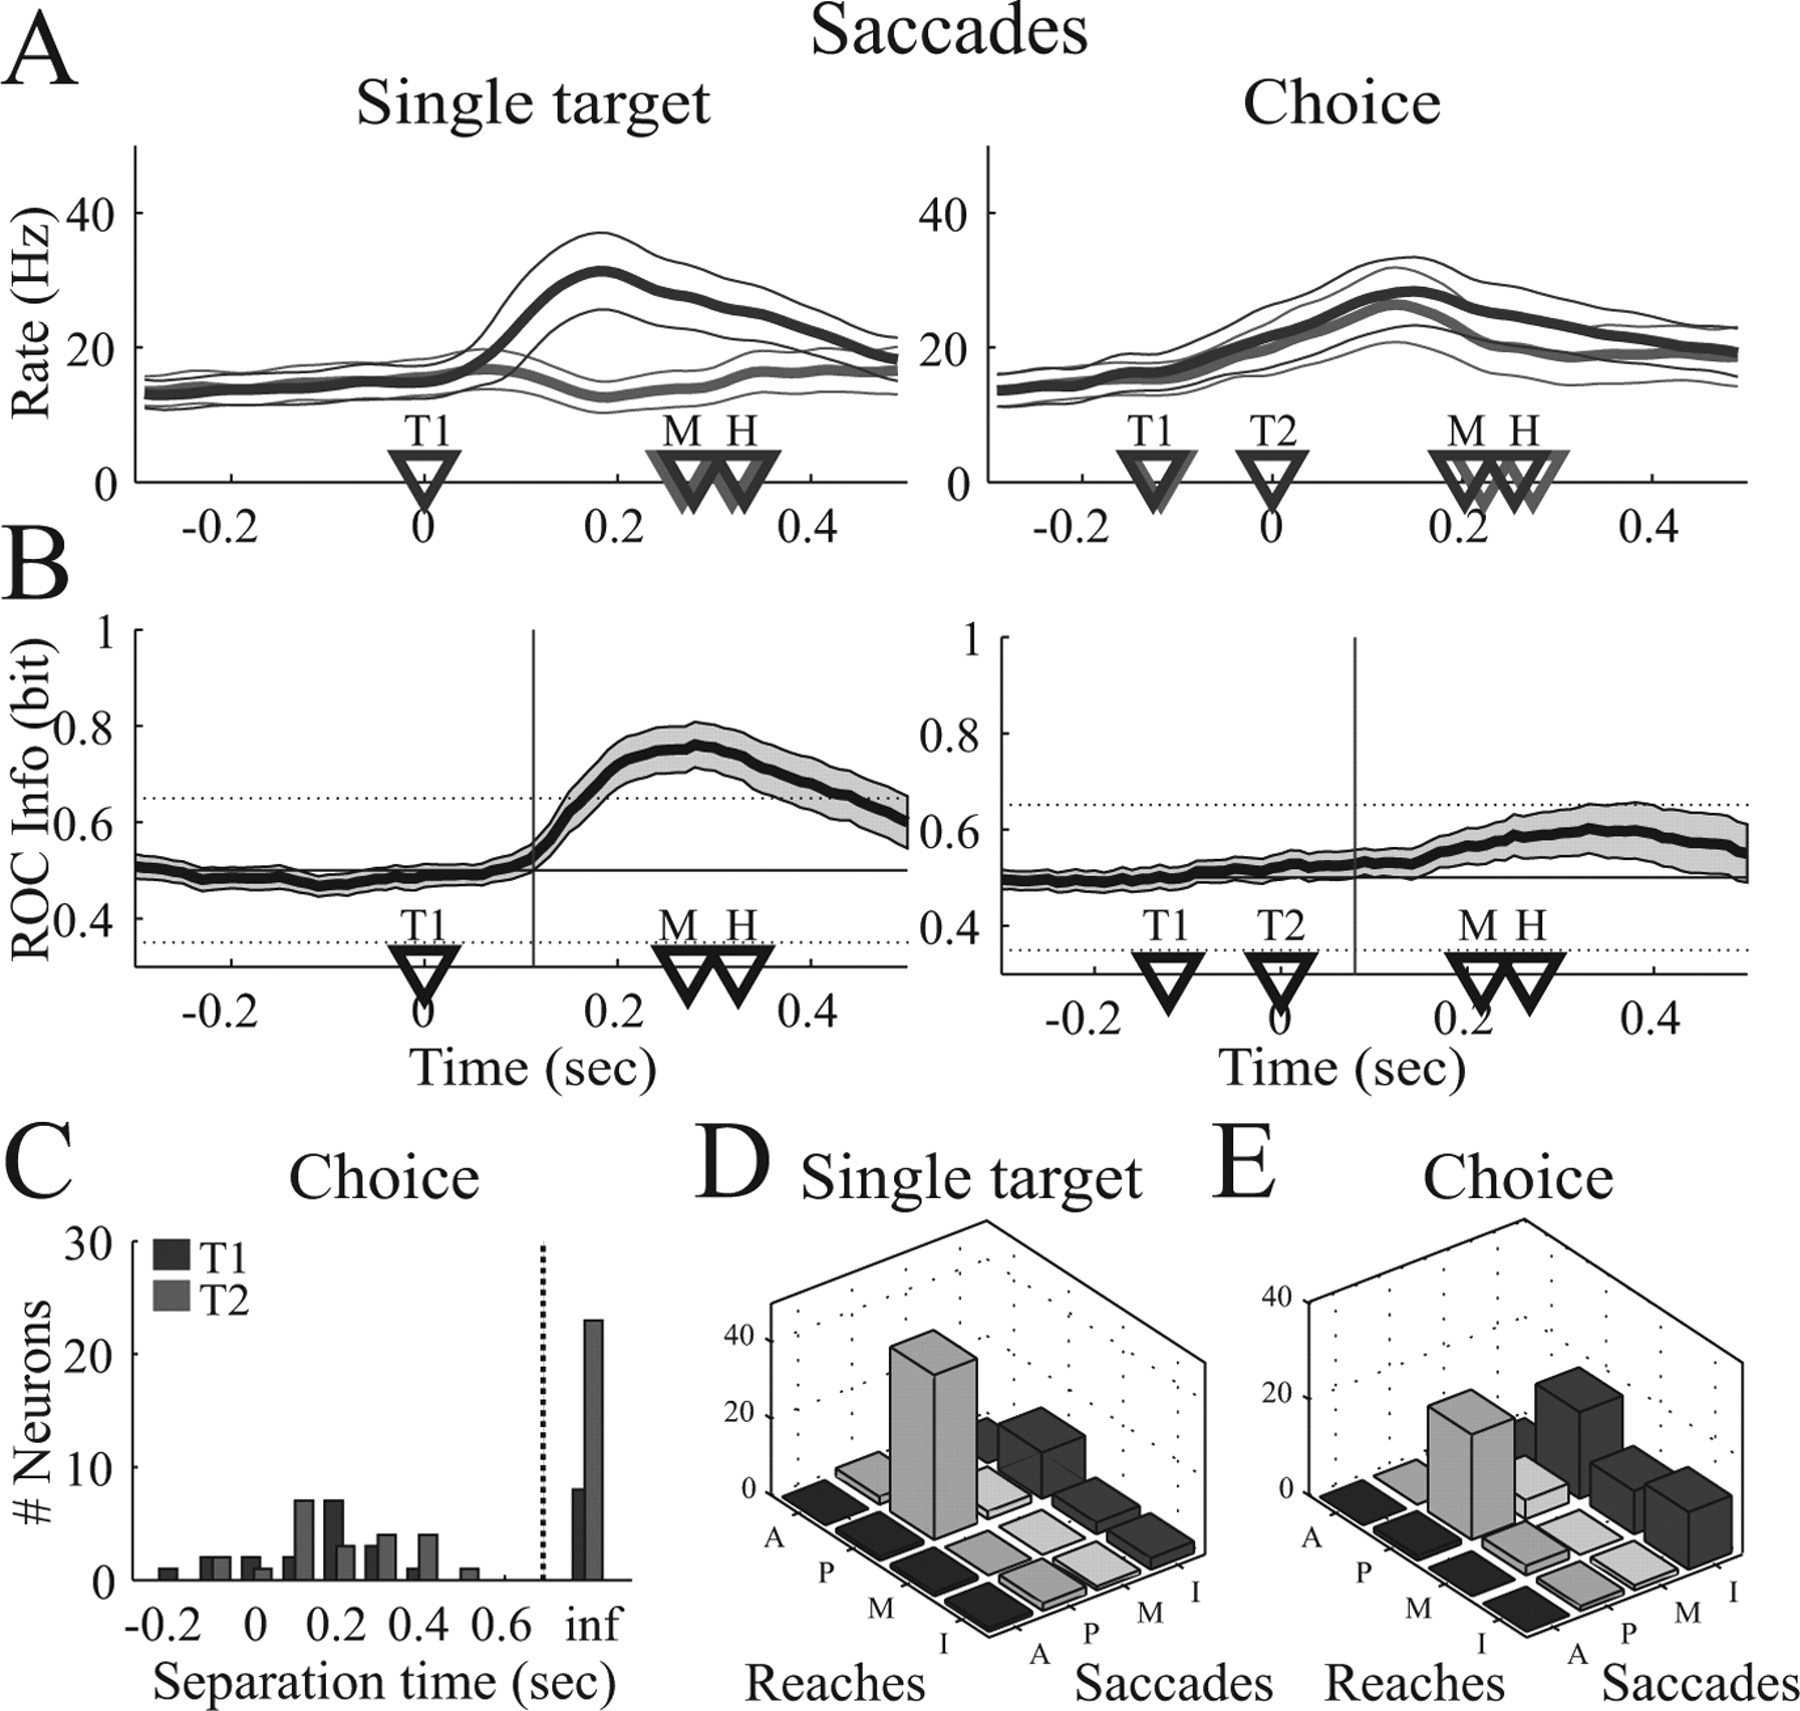
Figure 8.
Population activity in the saccade task. A, Mean firing rate for saccades to the preferred (dark curve) and nonpreferred (light curve) target. B, Mean ROC predictability of the population. Vertical line, Time when mean ROC curve significantly exceeds chance (p < 0.05). C, Histogram of separation time in the saccade choice task. D, Cell classification for reaches and saccades in the single-target and the choice task. Cells are classified in four groups: A, anticipatory (ts < T1); P, planning related (T1 ≤ ts < M); M, movement related (M ≤ ts < H); and I, indifferent (ts ≥ H or ts = ∞).


