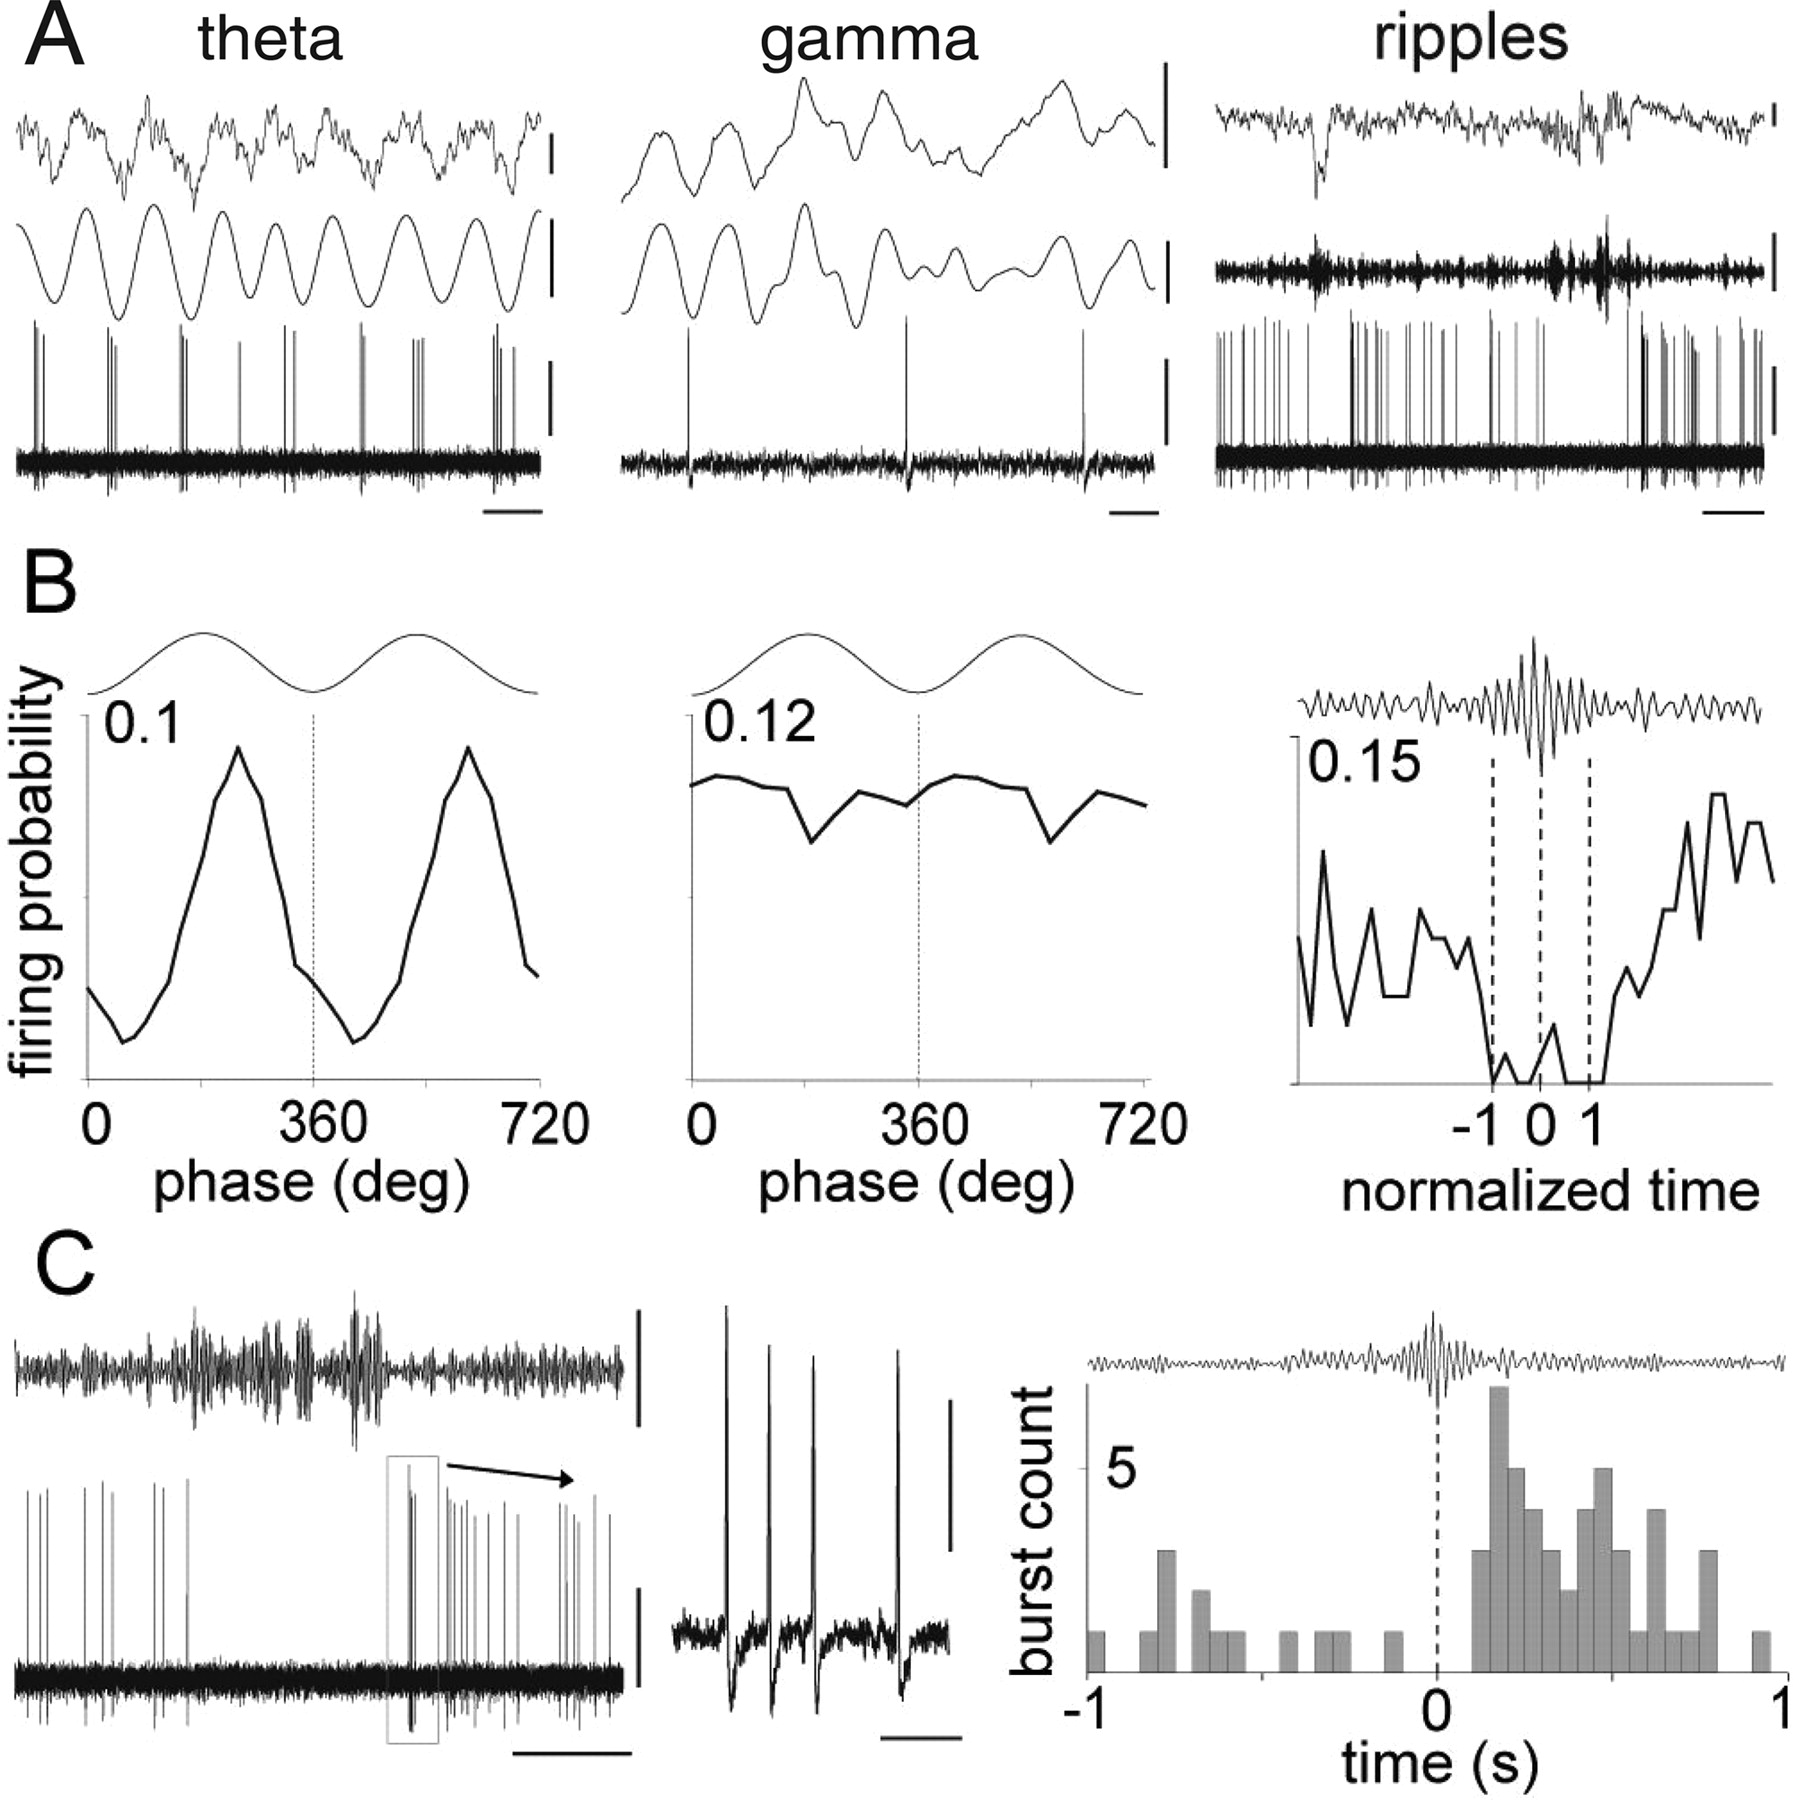
Spike timing of an identified ENK-expressing hippocampo-subicular cell during spontaneous network oscillations. A, Firing patterns (top, LFP; middle, LFP filtered; bottom, units) during theta (LFP filtered 3–6 Hz), gamma (LFP filtered 30–80 Hz), and sharp-wave-associated ripple (LFP filtered 90–140 Hz) oscillations recorded by a reference electrode located in stratum radiatum. B, Phase histograms of spikes in relation to locally detected oscillation troughs from the reference electrode (0, 360, and 720°; bin size, 18° for theta and 36° for gamma). The onset, highest amplitude, and end of normalized ripple episodes are marked as −1, 0, and 1, respectively (dotted lines). C, Left, Example of a burst discharge after a series of ripple episodes. Middle, The burst discharge at expanded time scale. Right, Perievent histogram showing increased burst discharge after ripple episodes (0 s indicates highest ripple amplitude; n = 80). Bin size, 50 ms. Calibrations: A, theta, top, 0.5 mV; middle, 0.5 mV; bottom, 0.5 mV; horizontal, 200 ms; gamma, top, 0.5 mV; middle, 0.2 mV; bottom, 0.5 mV; horizontal, 20 ms; ripples, top, 0.5 mV; middle, 0.1 mV; bottom, 0.5 mV; horizontal, 500 ms; C, left, top, 0.1 mV, 200 ms; bottom, 0.5 mV, 200 ms; inset, 0.5 mV, 10 ms.


