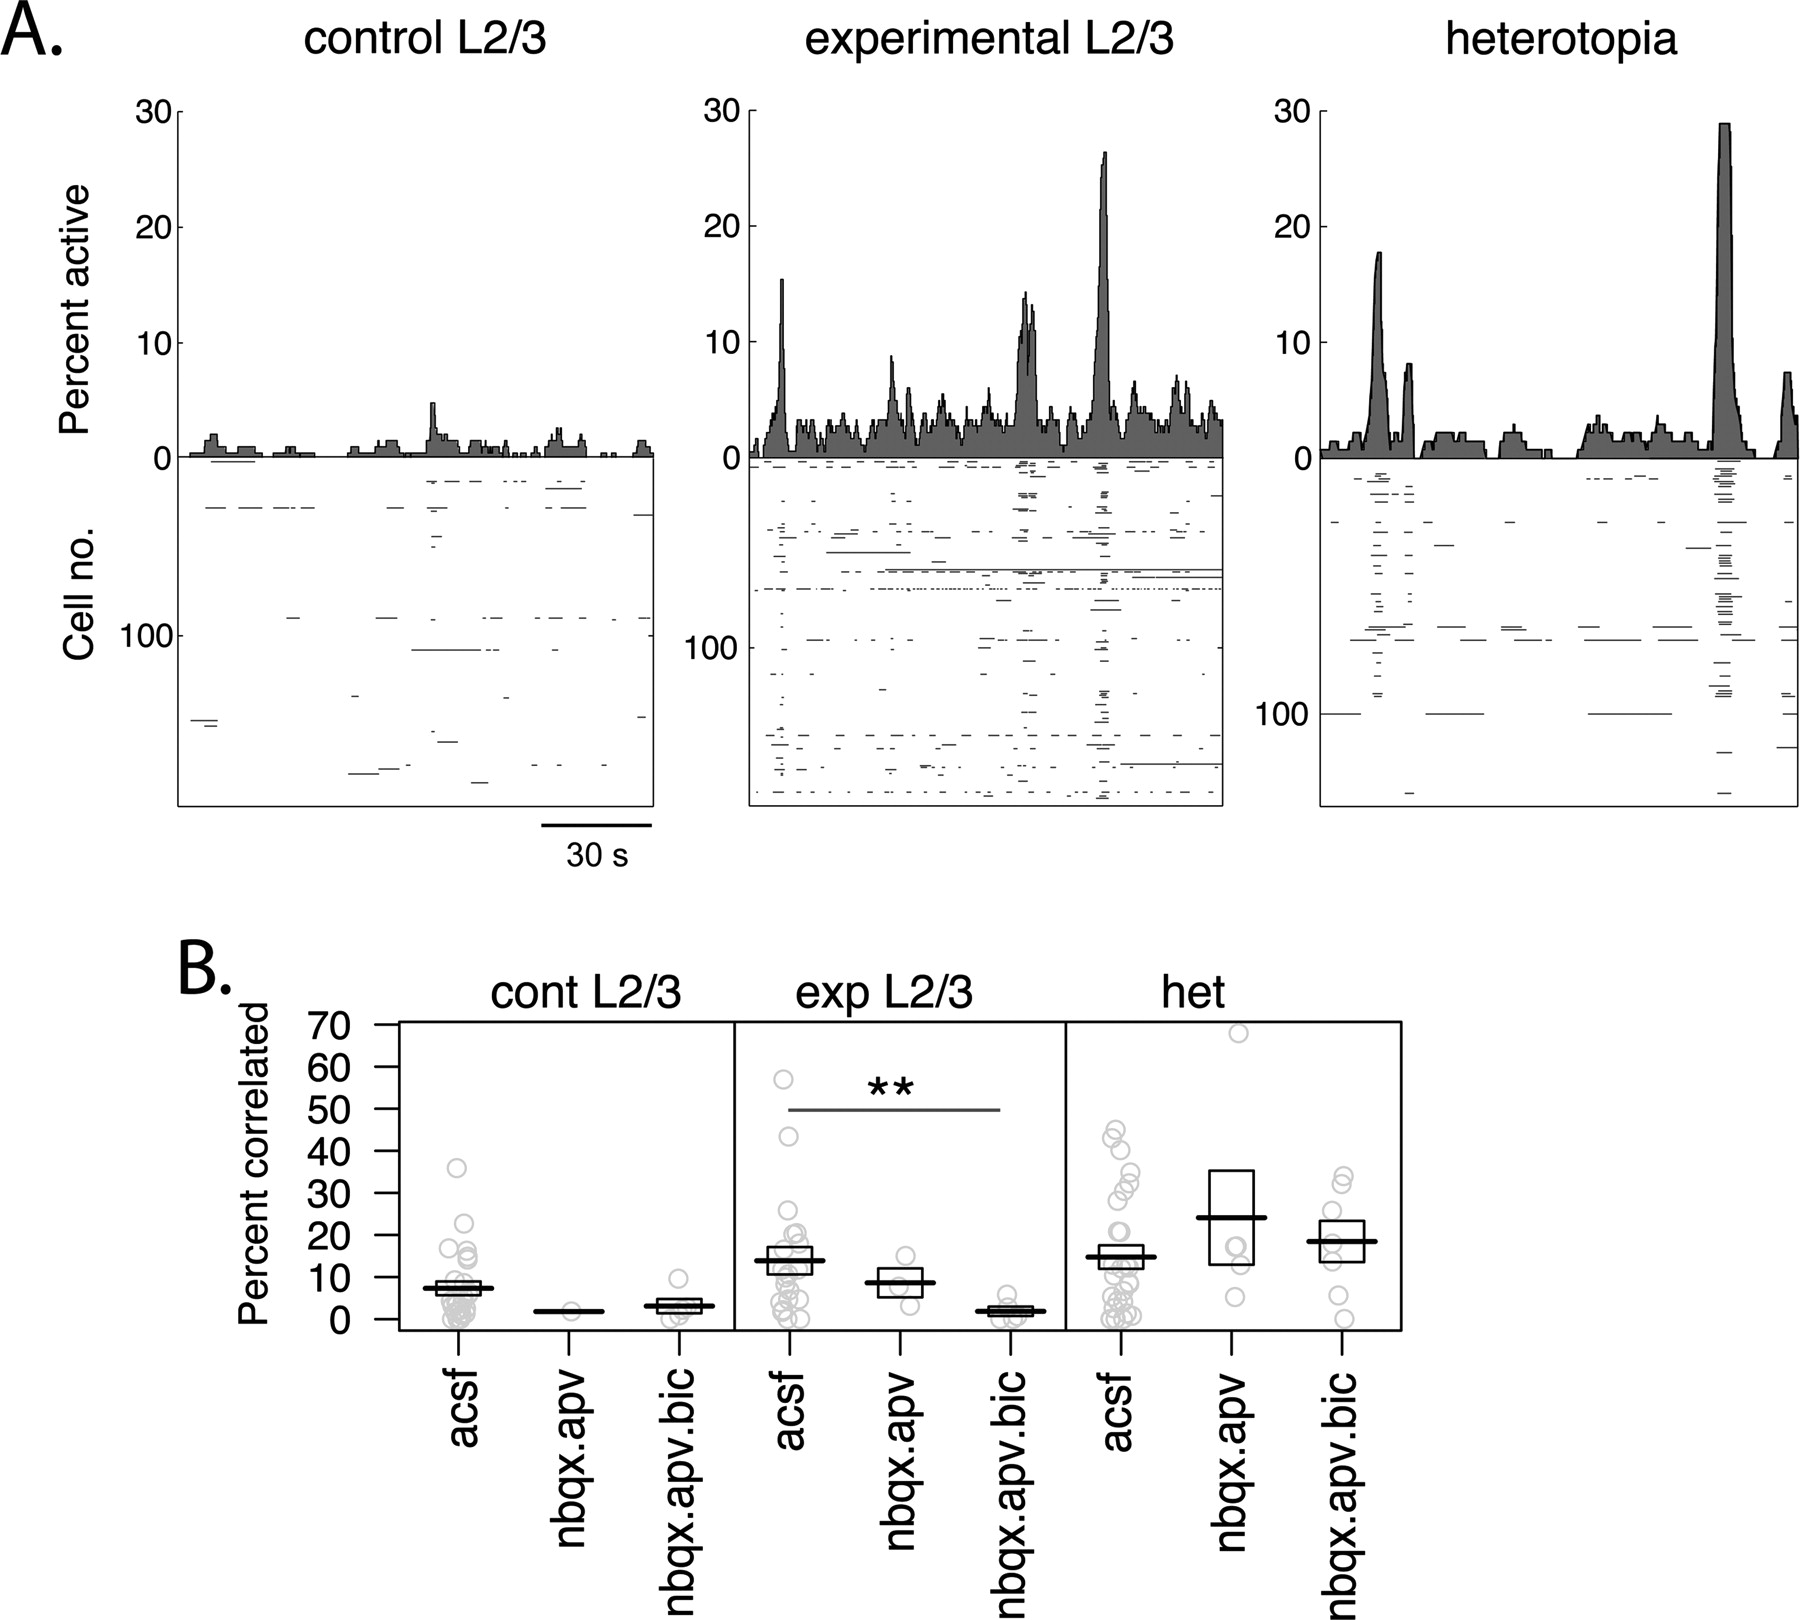
Correlated population events within the heterotopic and experimental L2/3 networks. A , Event duration histogram (top) and raster plot (bottom) from optical recordings of control L2/3 (left), experimental L2/3 (middle), and heterotopia from the same experimental slice (right). Histograms depict the percentage of imaged cells that are detected as being active at each movie frame, and raster plots indicate for each recorded neuron the times at which it displays calcium transients and their durations (horizontal lines). Experimental L2/3 and heterotopic networks have a significant increase in cells participating in correlated spontaneous calcium events with respect to the control L2/3 network. B , Population coherence in heterotopic and experimental L2/3 networks. Each circle represents the percentage of correlated cells within and during an optical recording. Means and ±1 SEM are represented by black boxes. Although the application of receptor antagonists significantly reduced the neuronal correlation in experimental L2/3, it failed to induce any significant change in the heterotopia. **p < 0.0078, Wilcoxon rank sum.


