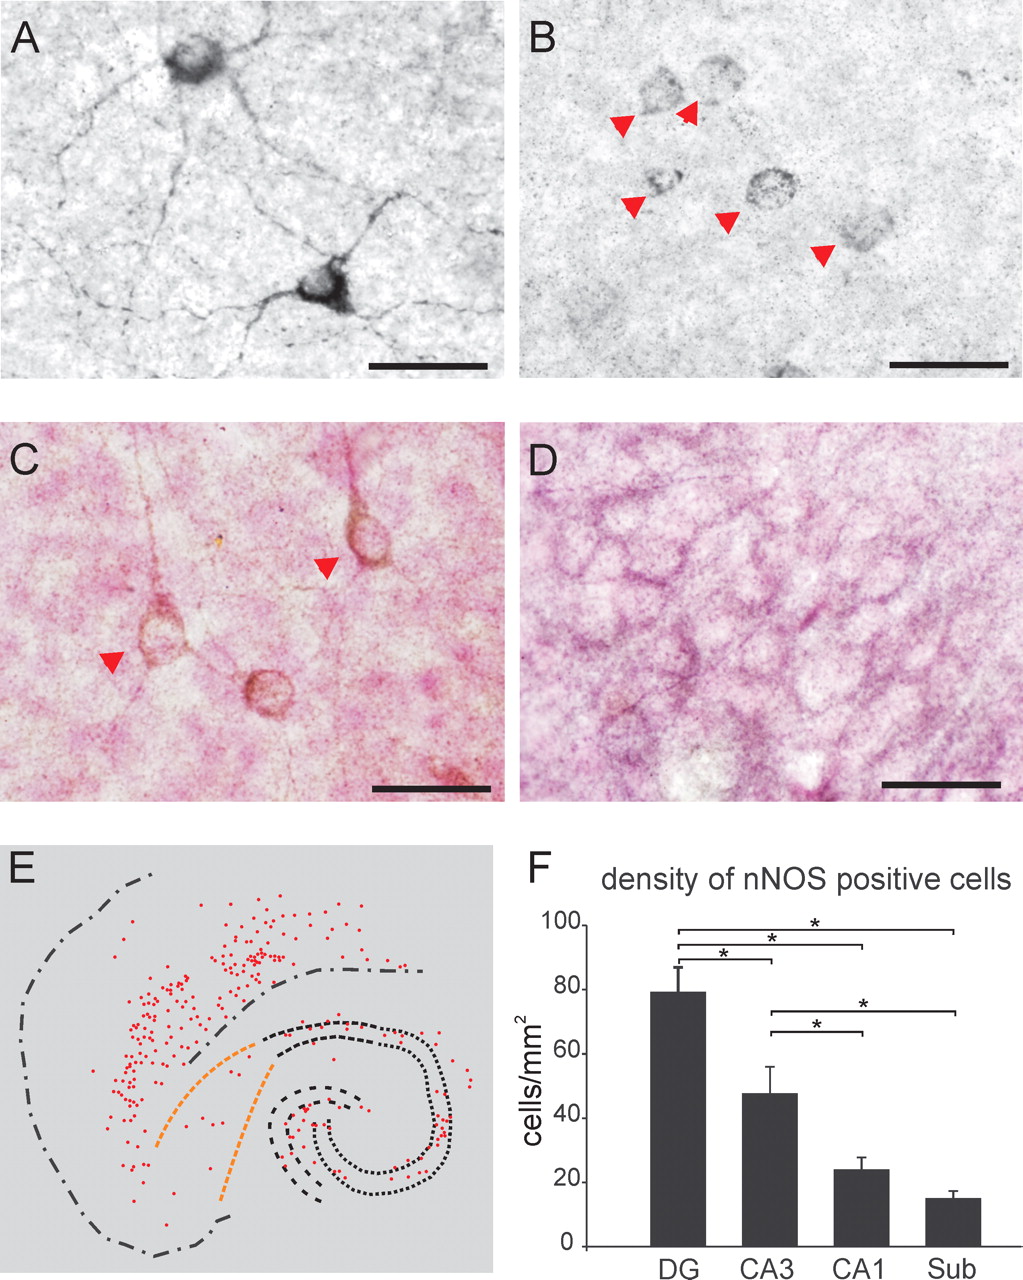
nNOS immunoreactivity in rat slice cultures. A, Representative photomicrograph of type I nNOS-immunopositive neurons in area CA3 displaying intense somatic and dendritic staining. The majority of type I neurons had stellate appearance, suggesting that they were interneurons. B, Type II nNOS-immunopositive cells (arrowheads) displayed dotted staining in their somata but not in dendrites. C, Pyramidal-shaped neurons corresponding to type I (arrowheads) were only sparsely observed in the stratum pyramidale. D, Dense network of nNOS-positive fibers was present throughout the whole slice culture, with the highest density in the subiculum. Slice cultures in C and D were counterstained with nuclear fast red. Scale bars, 20 μm. E, Distribution of nNOS-positive neurons (type I and II) in hippocampus and entorhinal cortex of a slice culture. F, Summary diagram showing the density of nNOS-positive neurons in different areas of the hippocampus. Density of the nNOS-positive neurons was highest in DG and area CA3. Regional densities were calculated by using the point grid method in counts obtained from five slice cultures (95 ± 7 cells per slice culture; see Materials and Methods). Sub, Subiculum.


