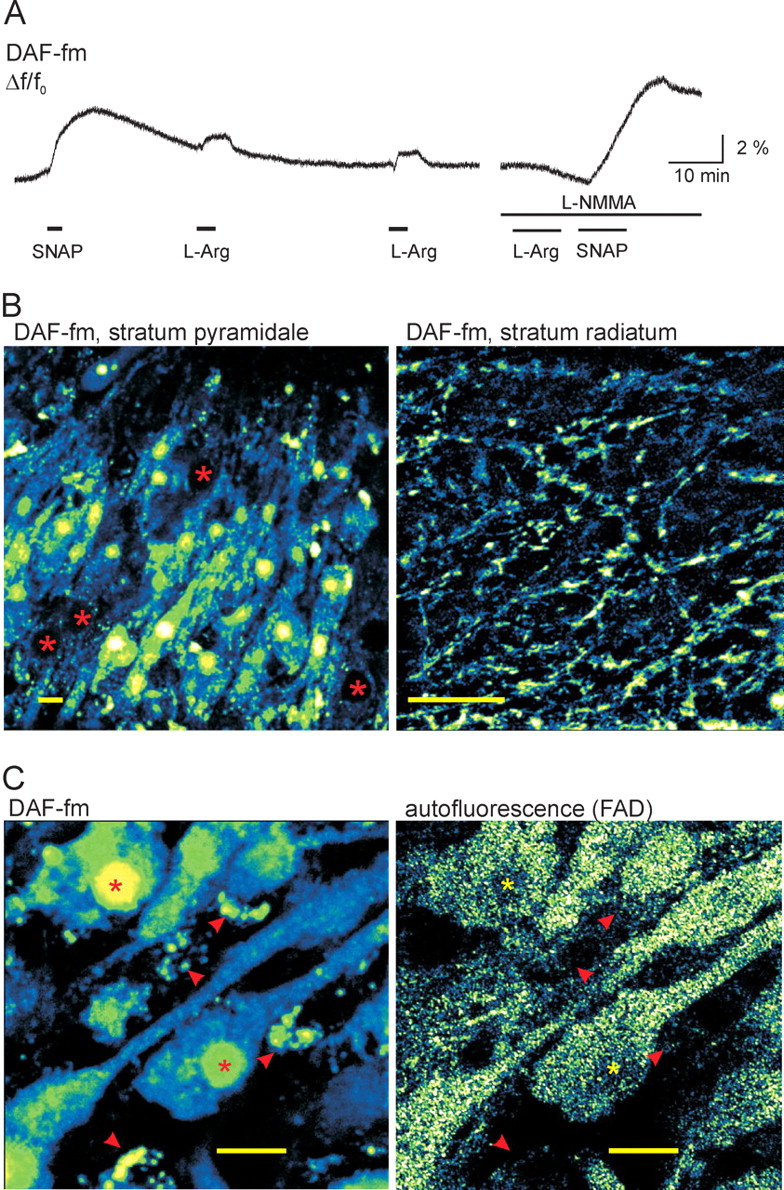
NO formation and DAF-fm staining pattern in rat slice cultures. A, Staining with the membrane-permeable diacetate form of DAF-fm revealed NO formation in slice cultures. Application of the exogenous NO donor SNAP (100 μm) resulted in an increase in intracellular DAF-fm fluorescence. Subsequent applications of the NOS substrate l-arginine (2 mm; L-Arg) also caused a transient fluorescence increase (left trace), which was blocked after preincubation of the slice culture with the NOS inhibitor l-NMMA (200 μm; right trace). Application of SNAP in the presence of l-NMMA still caused an increase in DAF-fm fluorescence. Fluorescence recordings were obtained with a 20× objective from the area CA3 by using photomultiplier-based microflurimetry. B, Representative confocal images from area CA3 of DAF-fm stained slice cultures. The fluorescent DAF-fm NO adduct accumulated in the cytosol and nucleus of most of the pyramidal cells in the stratum pyramidale (left). However, pyramidal cells with weak, dotted cytosolic staining were also observed (asterisks). In stratum radiatum, DAF-fm fluorescence appeared in dendrites and fibers (right). C, Comparison of DAF-fm (left) and FAD (right) autofluorescence in the same CA3 pyramidal cells. Images were obtained at the respective excitation maxima for DAF-fm (488 nm) and FAD (450 nm). Homogeneous DAF-fm fluorescence was observed in the cytosol and bright staining in the nucleus of pyramidal cells (asterisks). Additionally, small vesicles were present in the intracellular space (arrowheads), likely representing microglial phagocytosis of the dye. In contrast, autofluorescence originating from FAD showed a dotted staining pattern in the cytosol, which was weaker in the nucleus (asterisks) and absent in the small vesicles (arrowheads). The fluorescence was acquired as “z-stack,” and three-dimensional projection was reconstructed from 5 to 10 focal planes (0.5–1 μm steps). Scale bars, 10 μm.


