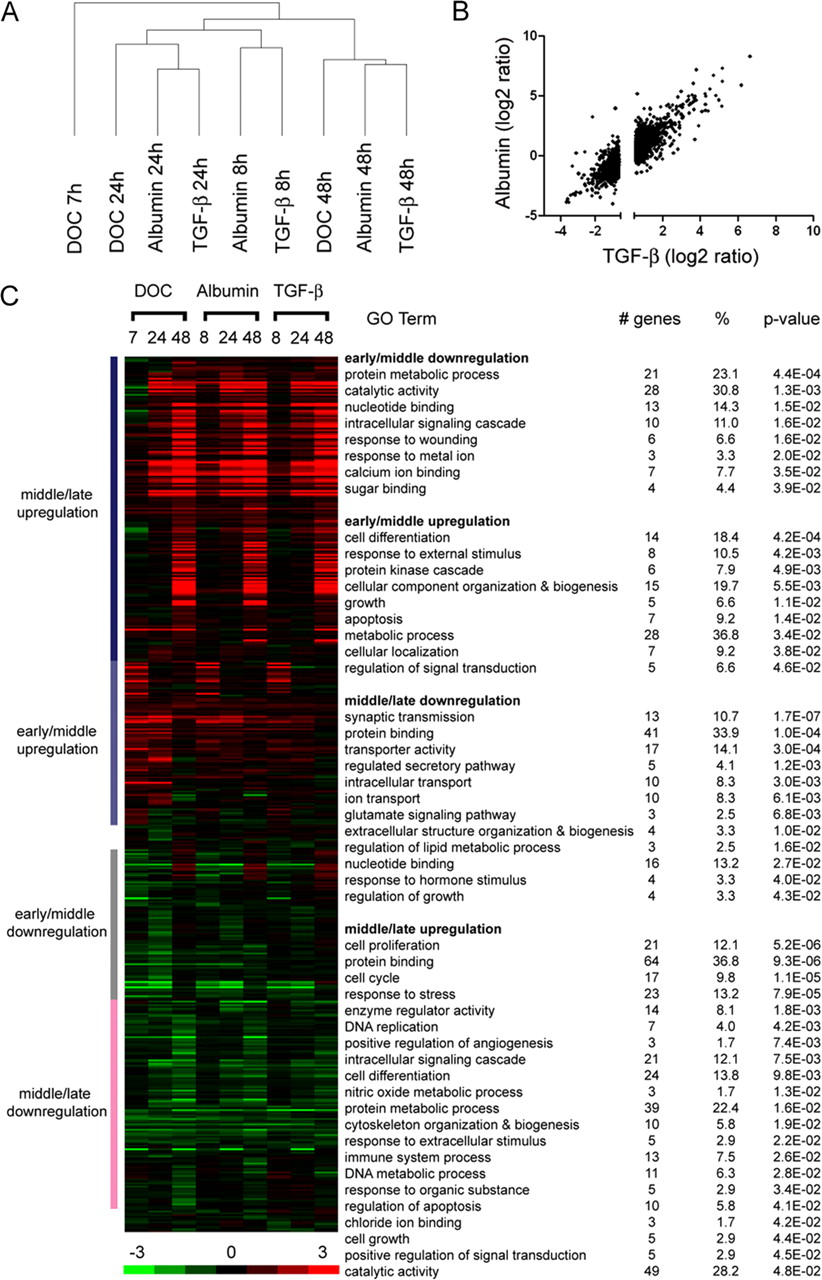
Genome-wide transcriptional analysis after epileptogenic treatments. A , Hierarchical clustering of arrays corresponding to 7/8, 24, and 48 h after DOC, albumin, and TGF-β1 treatments. Note how arrays cluster together for each time point across all treatments. Genes showing at least a 1.5-fold change in expression were included. B , Linear regression analysis between TGF-β1 and albumin treatments at 24 h. Only genes with a fold change equal to or >1.5 for the TGF-β1 treatment were included. C , Hierarchical cluster analysis of genes showing correlation (>0.95) between all treatments. Selected clusters were annotated with DAVID to reveal biological themes common to all treatments. Color bar indicates range of log2 ratios.


