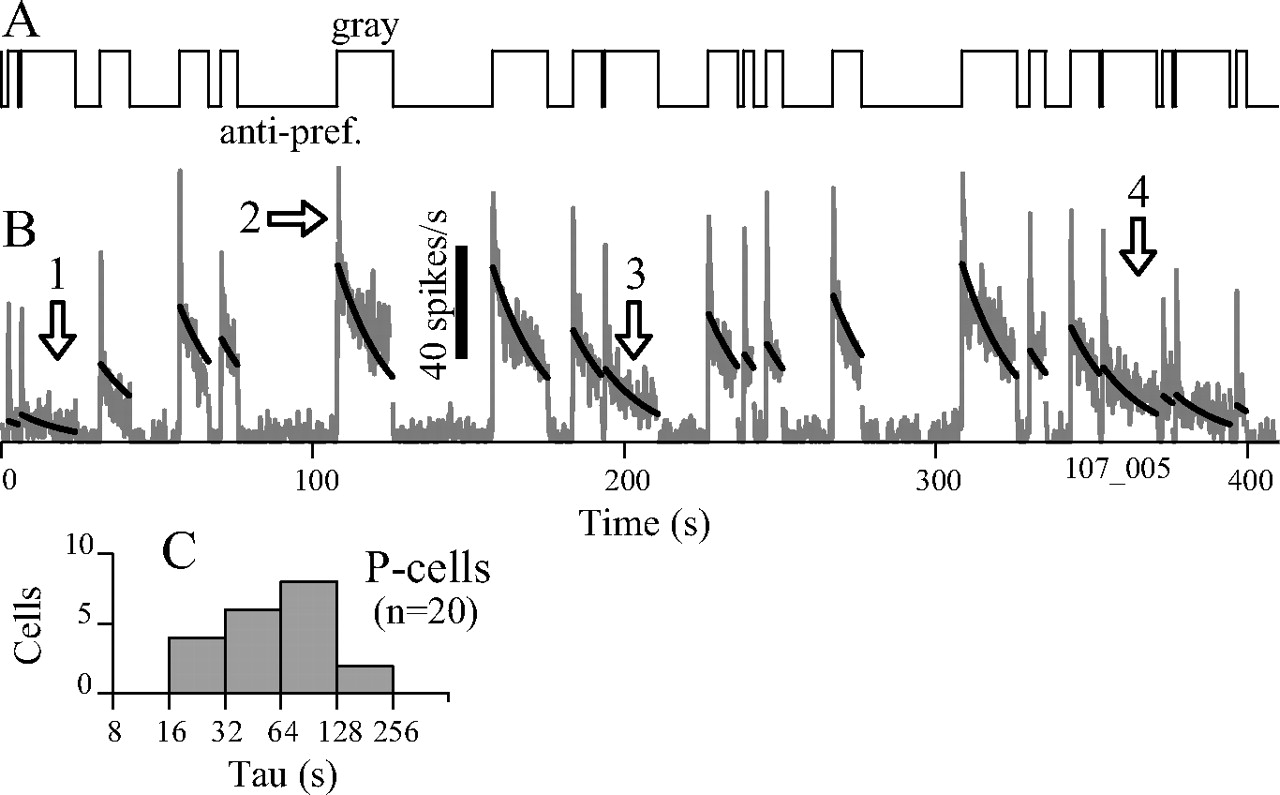
Figure 4.
After responses following variable-duration antipreferred stimuli. A, Stimulus contrast varies over time from 0 (gray) to −1 [antipreferred (anti-pref.)]. B, Response (gray curve) of a P-cell (Figs. 1, 2, cell 1) is low when the antipreferred stimulus is present and higher when the screen is gray. Black lines show a model fit (see Materials and Methods; Eq. 1). The time constant (τ = 18 s; full 1250 s response) was fitted. C, Distribution of τ for fits, 20 P-cells (range, 17–240 s; mean, 75 s; SD, 54 s). The median percentage-explained variance was 70%; the value for example B was 81%.


