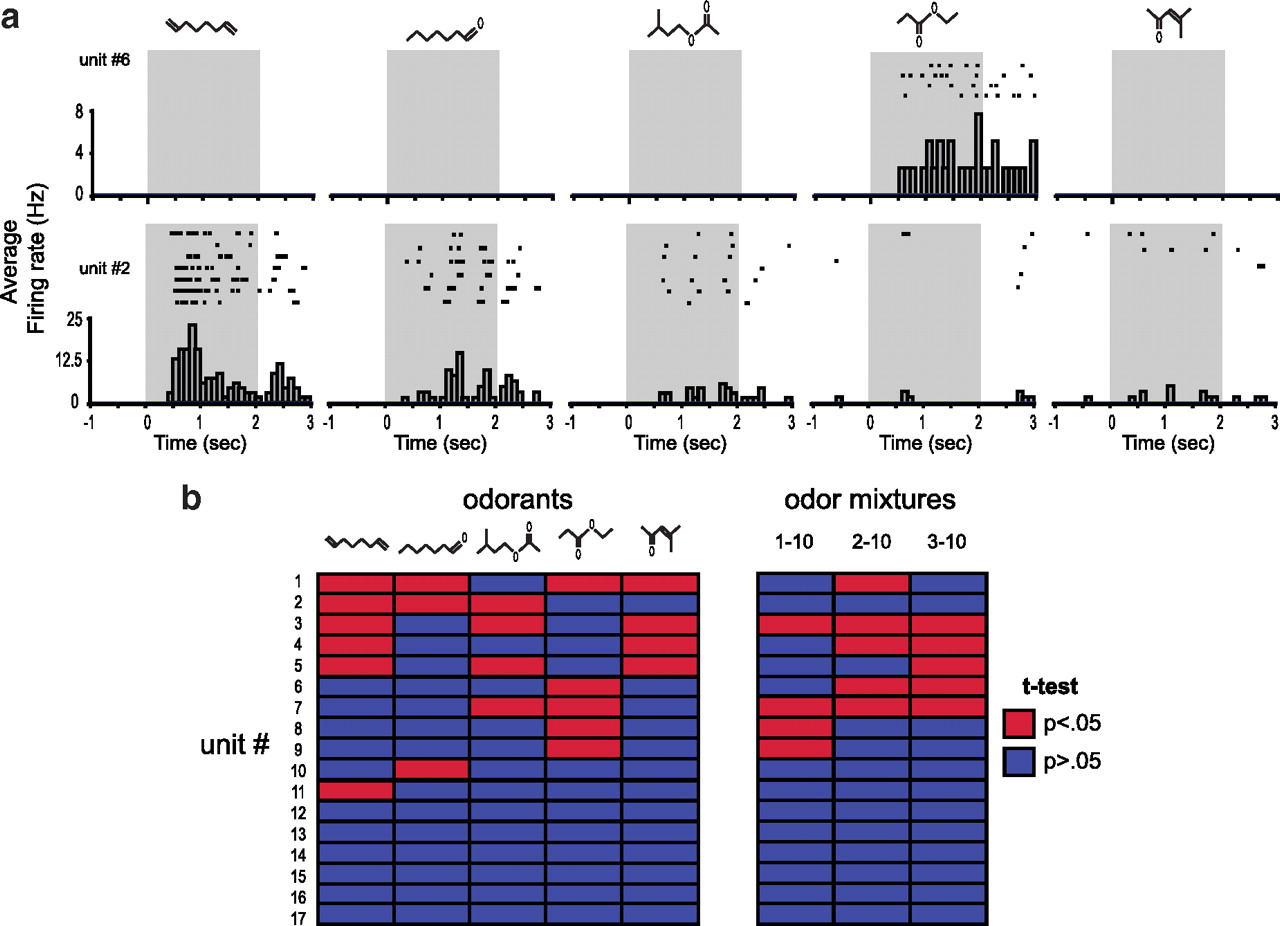
Odorant responsivity of tubercle units. a, Spike raster plots and peristimulus time histograms from two units (2 separate mice) throughout multiple presentations with five different odorants (gray-shaded regions). The top halves of each panel shows spike activity as raster plots (dots) of single units in response to each of the five odorants across multiple trials (y-axis; each row is a single trial). Summarizing each raster plot is a peristimulus time histogram with average firing rate (in hertz) on the y-axis. Odorants are as follows (from left to right): 1,7-octadiene, ethyl proprionate, heptanal, isoamyl acetate, and 4-methyl-3-penten-2-one. Histograms, 100 ms time bins. b, Statistical summary of odor selectivity of 17 tubercle units in response to the five odorants outlined in a and three odorant mixtures (right matrix) (see Materials and Methods). The red cells indicate significant responses across all trials (p < 0.05, two-tailed t test, 2 s prestim vs 2 s during stim). Units 6 and 2, Same data as in a. Whereas some units (e.g., 1 and 3) responded to all but one or two odorants, other units (e.g., 11) responded to only one odorant.


