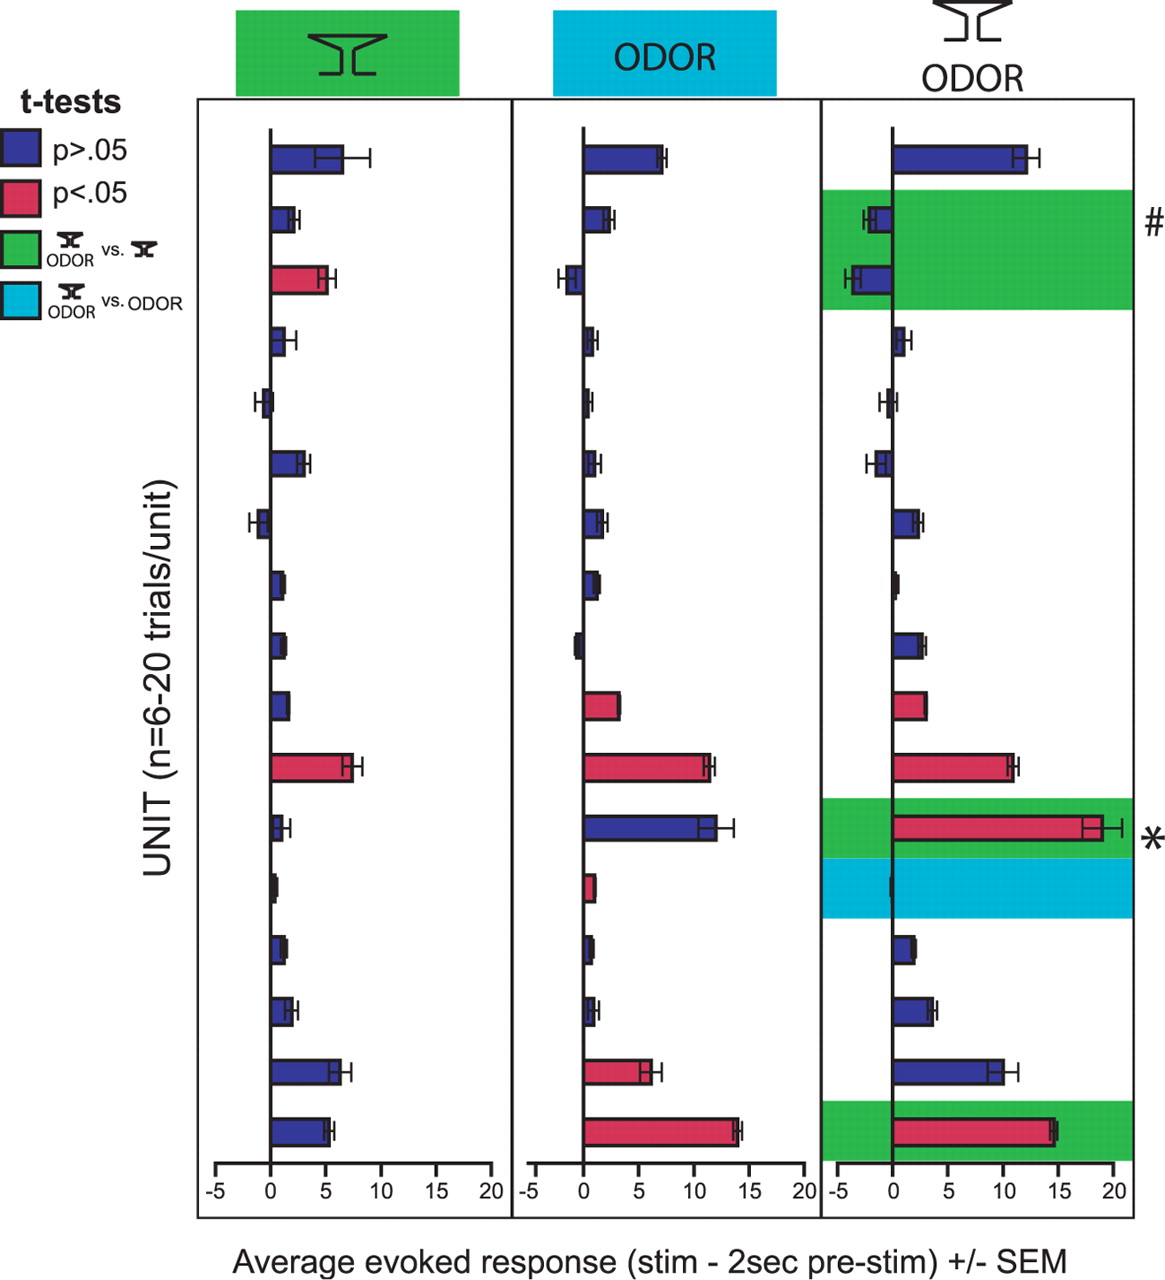
Subpopulations of tubercle single units show olfactory–auditory cross-modal modulation. Bar graphs of average evoked responses across 17 units (different from those in Fig. 4), in response to tone (left), odor (middle) (for odor, see Materials and Methods), and simultaneous tone and odor presentations (right column). The red bars indicate significant responses of that unit across all trials (p < 0.05, two-tailed t test, 2 s prestim vs 2 s during stim). The blue bars are insignificant (p > 0.05). The green background color behind bars indicates that response of that unit is significantly different from responses of that unit to tone alone (p < 0.05, two-tailed t test). The blue background color behind bars indicate that response of that unit is significantly different from responses of that unit to odor alone (p < 0.05, two-tailed t test). Whereas some units (e.g., indicated with “*”) showed supraadditive responses to both stimuli simultaneously, others (e.g., indicated with “#”) showed suppressive responses. Error bars indicate SEM.


