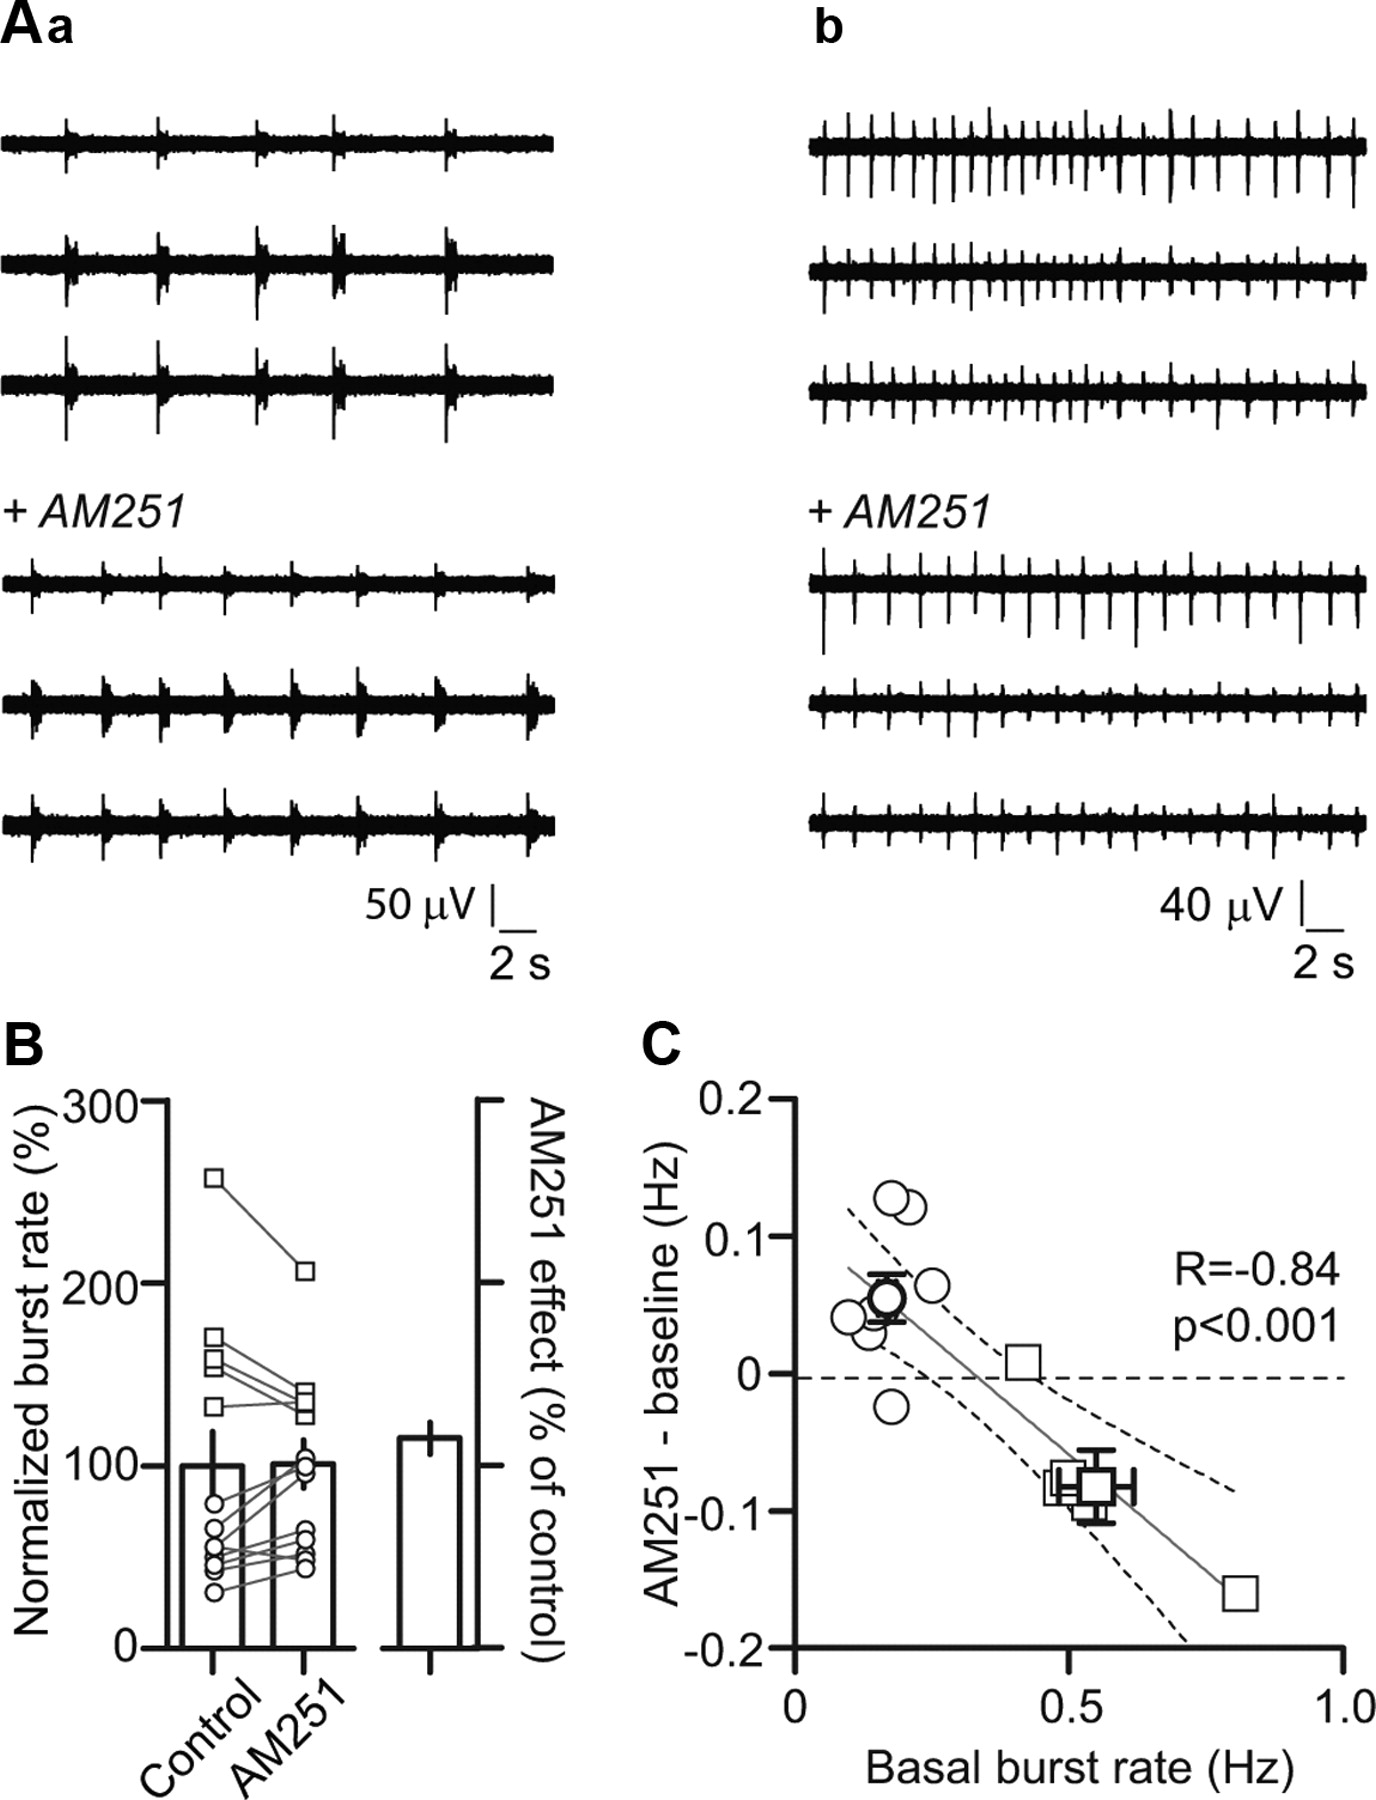
Endogenous modulation of network activity by CB1Rs. Aa, Sample traces illustrating the excitatory effect of AM251. Ab, Sample traces from a different culture where AM251 caused a decrease in burst rates. B, Summary graph of 13 different experiments (left; connected symbols represent individual recordings). The bar on the right illustrates the average effect of AM251 on burst rates. C, Effect of AM251 expressed as a function of basal burst rate. AM251 increased bursting in cultures with lower basal burst rates (<0.35 Hz; n = 8; white circles), whereas it was inhibitory in cultures with higher basal burst rates (>0.35 Hz; n = 5; white squares). Bold symbols with error bars illustrate the averages for the two groups. Solid and dashed lines represent the linear regression and 95% confidence interval, respectively.


