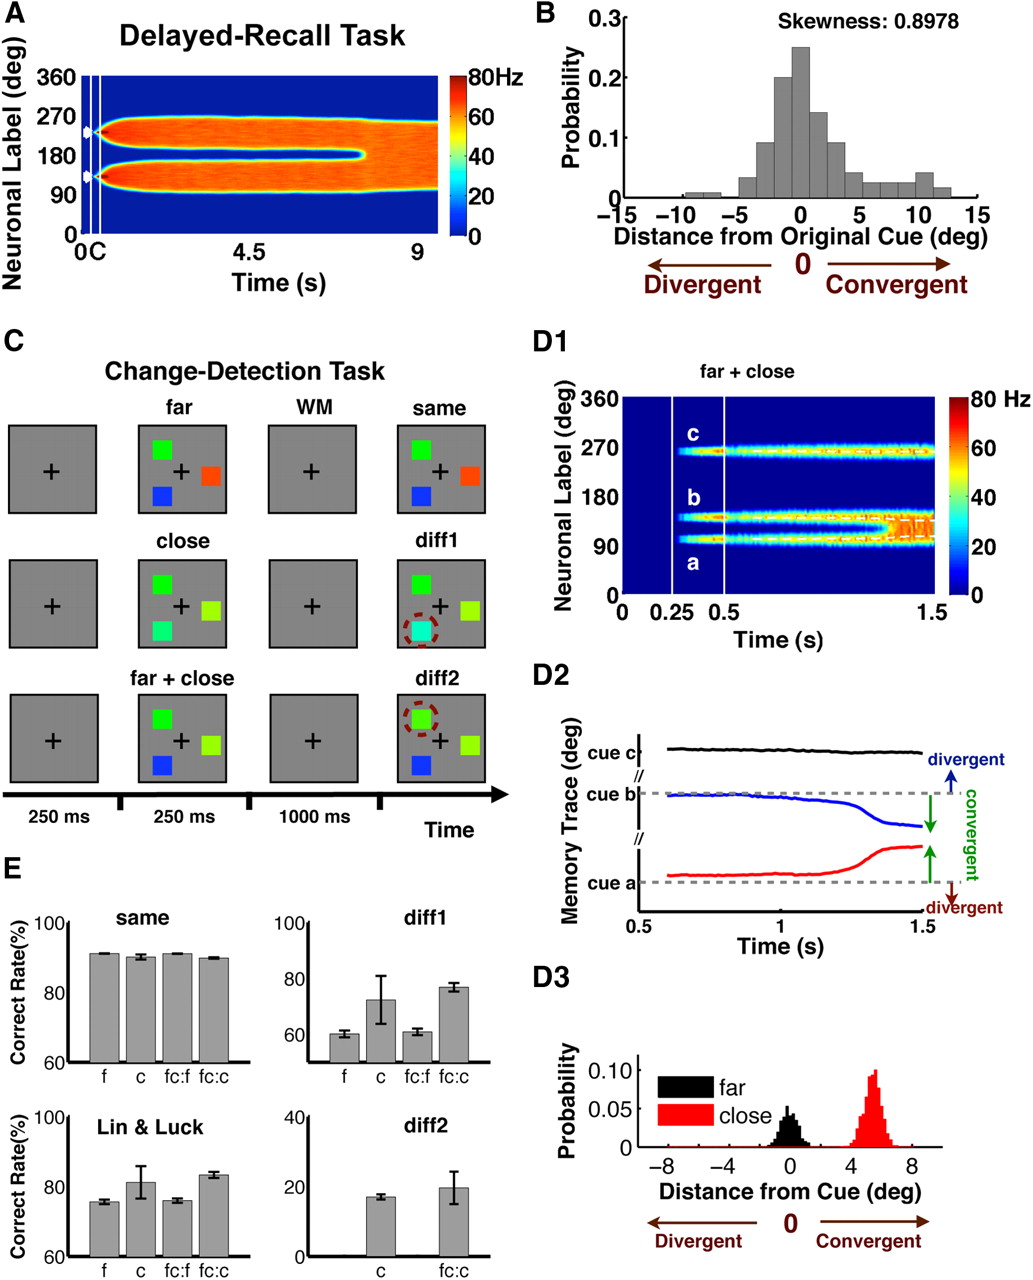
Behavioral manifestation of merging in the change-detection task and free-recall task. A, Merging happens even when two cues are sufficiently separated from each other: θin,1 = 130° and θin,2 = 230° (white arrows) in DRTs. Two stimuli evoke two activity bumps, which eventually merge into a single wide bump. Therefore, the reports bias to the center of θin,1 and θin,2. B, The distribution of the difference between the report and the original cue, θin,2 − θout,2 or θout,1 − θin,1 (θin,1 < θin,2), across 100 trials. A positive (respectively, negative) distance from the original cue implies convergence (respectively, divergence) of two activity bumps. The distribution skews significantly to the positive side, indicating that merging happens in a large amount of trials. Such a skewed distribution of reports can be tested in behavioral experiments. C, Experimental scheme of a change-detection task to test merging. In each trial, network views a cue array (3 colors) and a test array, separated by a 1 s delay, and identifies whether they are the same. Three types of cues, i.e., far (low-similarity), close (high-similarity), and far+close, and three types of tests, i.e., same, diff1 (divergent side), and diff2 (convergent side; changed colors in diff1 and diff2 are circled) are applied in the task; the Lin and Luck (2009) task is a mixture of same (50%) and diff1 (50%) tests. D1, D2, A sample from far+close trials (2 greens + 1 blue) exhibits a merging process between 2 greens (a, b), the memory traces of which converge to an intermediate level (still greens); the memory trace of the blue (c) only drifts around its initial cue. D3, Distributions of the response offset in different trials. That with low similarity (black bars) centers at 0°; that with high similarity (red bars) shows a strong bias to the convergent side (>0°). E, Performance for each test. Low- and high-similarity trials show similar performance in the same test (upper left). High-similarity trials show a better performance in the diff1 test (upper right), indicating that similarity of the cue array improves the change-detection performance in the Lin and Luck (2009) task (lower left), whereas it also shows that the similarity could deteriorate the performance in the diff2 test (lower right).


