Corelease of Dopamine and GABA by a Retinal Dopaminergic Neuron
- 1Department of Neurobiology, Harvard Medical School, Boston, Massachusetts 02115, and
- 2Department of Biostatistics, Harvard School of Public Health, Boston, Massachusetts 02115
-
Author contributions: H.H. and E.R. designed research; H.H. and E.R. performed research; R.A.B. analyzed data; H.H. and E.R. wrote the paper.
Abstract
Numerous neurons release two transmitters of low molecular mass, but it is controversial whether they are localized within the same synaptic vesicle, with the single exception of GABA and glycine because they are ferried into the vesicle by the same transporter. Retinal dopaminergic (DAergic) amacrine cells synthesize both dopamine (DA) and GABA. Both transmitters are released over the entire cell surface and act on neighboring and distant neurons by volume transmission, but, in addition, DAergic cells establish GABAergic synapses onto AII amacrine cells, the neurons that transfer rod signals to cone bipolars. By combining recordings of DA and GABA release from isolated, genetically identified perikarya of DAergic cells from the mouse retina, we observed that a proportion of the events of DA and GABA exocytosis were simultaneous, suggesting corelease. Furthermore, a proportion of the secretory organelles in the perikaryon and synaptic endings of DAergic cells contained both vesicular transporters for DA [vesicular monoamine transporter 2 (VMAT2)] and GABA [vesicular GABA transporter (VGAT)]. Because the majority of the DA release events concerned a single transmitter and organelles were present that contained a single transporter, either VMAT2 or VGAT, we conclude that the secretory organelles of DAergic cells contain variable concentrations of the two transmitters, which are in turn determined by a variable mixture of the two transporter molecules in their limiting membrane. This variability can be explained if the relative numbers of transporter molecules is determined stochastically during the budding of the somatic organelles from the trans-Golgi network or the retrieval of the vesicular membrane from the plasmalemma after exocytosis.
Introduction
In the CNS, there is convincing evidence for colocalization of dopamine (DA) with other low-molecular-mass transmitters that act on ionotropic postsynaptic receptors and therefore convey faster excitatory signals to the postsynaptic cell (Seal and Edwards, 2006; Hnasko and Edwards, 2012). Midbrain dopaminergic (DAergic) neurons make excitatory glutamatergic synapses onto the projection neurons of the accumbens (Sulzer et al., 1998; Joyce and Rayport, 2000; Chuhma et al., 2004; Stuber et al., 2010), and cotransmission of DA and GABA was observed in the periglomerular cells of the olfactory bulb (Maher and Westbrook, 2008). In the retina, the DAergic amacrine cells release DA (Puopolo et al., 2001) and GABA (Hirasawa et al., 2009) extrasynaptically and establish GABAergic synapses onto AII amacrine cells (Contini and Raviola, 2003), a neuron that transfers rod signals to cone bipolars.
Because of their dual transmitter phenotype, DAergic cells exert complex functions in the retina: DA is released during illumination, diffuses throughout the retina, and acts by volume transmission on most types of retinal neurons, setting their gain for vision in bright light (Witkovsky, 2004). The physiological significance of the GABA released by DAergic cells has not been established with certainty: by inhibiting the postsynaptic target of the DAergic cells, GABA may prevent signals of the saturated rods from entering the cone pathway when the dark-adapted retina is suddenly exposed to bright illumination. Thus, inhibition may cause the silent pause and hyperpolarization of the AII amacrine cell when the stimulus reaches photopic range during an intensity series (Xin and Bloomfield, 1999). On the other hand, the GABA released extrasynaptically by DAergic cells, in concert with other GABAergic amacrines (Hirasawa et al., 2009), may prevent crosstalk between OFF and ON pathways in the crowded environment of the inner plexiform layer (vertical inhibition; Roska and Werblin, 2001; Farajian et al., 2011).
In all instances of colocalization or corelease, different vesicular transporters, vesicular monoamine transporter 2 (VMAT2) for DA, vesicular GABA transporter (VGAT) for GABA, and the various vesicular glutamate transporter (VGLUT) isoforms for glutamate, load the transmitters into membrane-bounded secretory organelles (Seal and Edwards, 2006; Edwards, 2007), either 40–50 nm synaptic vesicles or 80–90 nm large dense-core vesicles (LDCVs; Nirenberg et al., 1996, 1997). The question therefore arises whether the two transmitters are stored within the same or separate organelles. Unfortunately, in retinal DAergic cells, the metabotropic receptors for DA do not colocalize at the postsynaptic active zone with the ionotropic receptors for GABA. It is therefore impossible to deduce the composition of the transmitter contents of individual presynaptic vesicles by teasing out pharmacologically different components of the miniature postsynaptic currents, as done previously for GABA and glycine (Jonas et al., 1998; O'Brien and Berger, 1999) or glutamate and acetylcholine (ACh) (Li et al., 2004).
In this study, we tested by simultaneous patch clamp and amperometry whether GABA and DA are coreleased by genetically identified cell bodies of DAergic amacrines, and we used immunocytochemistry to investigate the colocalization of VMAT2 and VGAT in the intact retina.
Materials and Methods
Animals.
We used C57BL/6J mice of either sex, both wild type (The Jackson Laboratory) and transgenic, the latter expressing human placental alkaline phosphatase (PLAP) under control of a 4.8 kb promoter sequence of the rat tyrosine hydroxylase (TH) gene (Gustincich et al., 1997). All procedures involving mice were in accordance with National Institutes of Health guidelines and approved by the Institutional Animal Care and Use Committee of Harvard Medical School.
Electrophysiology.
The procedure for dissociation of the retina and short-term culture of the resulting cell suspensions were described in detail previously (Hirasawa et al., 2009). Briefly, retinas of 1- to 3-month-old transgenic mice whose catecholaminergic neurons were labeled by PLAP were incubated with papain (5–10 U; Worthington) and subsequently triturated by squeezing them through the bore of fire-polished Pasteur pipettes. To identify DAergic cells, the suspension was resuspended in minimum essential medium containing 1:100 monoclonal antibody to PLAP (E6; de Waele et al., 1982) directly conjugated to the fluorescent dye Cy3 (E6–Cy3). Cells were allowed to settle onto concanavalin A-coated glass coverslips glued to the bottom of Petri dishes that were mounted on the stage of an inverted microscope (Nikon Diaphot 300; Micro Video Instruments). DAergic cells, stained by E6–Cy3, were identified by scanning the coverslip in epifluorescence. Once the DAergic cells were identified, the remaining procedures were performed in visible light with differential interference contrast optics.
Patch pipettes with tip resistance of 3–5 MΩ for whole-cell recording were constructed from borosilicate glass. Electrodes were connected to an Axopatch 200B amplifier (Molecular Devices) controlled by pClamp 8.0 analysis software (Molecular Devices), and current or voltage output was viewed directly on the screen of a computer attached to the amplifier via a DigiData 1200 Interface (Molecular Devices). The digitized data were stored on a personal computer and analyzed with Origin 6.1J (OriginLab). Frequency of the low-pass Bessel filter in the amplifier was set at 2 kHz. Sampling frequency was 6.7 kHz. Bath temperature was routinely kept at 30–31°C with a heater controller (TC-344B; Warner Instruments).
Membrane currents of DAergic cells were recorded by using the whole-cell configuration of the patch-clamp technique as described previously (Feigenspan et al., 1998). The standard extracellular solution contained the following (in mm): 137 NaCl, 5.4 KCl, 2 CaCl2, 1 MgCl2, 5 HEPES, and 10 glucose, pH 7.4. The pipette solution contained the following (in mm): 111–115 CsMeSO3, 10 NaCl, 10 tetraethylammonium-Cl, 10 HEPES, 0.05 EGTA, 1 MgCl2, 14 phosphocreatine, 3 ATP-Mg, and 0.3 GTP-Na, pH 7.2. The liquid junction potential of the pipette solution (approximately −10 mV, measured by using a 3 m KCl agar bridge) was corrected. Series resistance was maintained at <20 MΩ and uncompensated.
Amperometric recordings were obtained with polyethylene-insulated, carbon fibers 5 μm in diameter (T650; Cytec Carbon Fibers). Immediately before use, the tip of the electrode was cut with a razor blade, beveled at a 45° angle with a diamond-coated polishing wheel (Sutter Instruments) and cleaned by ultrasonication in isopropanol for 3 s. Electrodes were backfilled with a 4 m potassium acetate and 150 mm KCl solution, and electrical connection to the head stage (CV201A/Axopatch 200A; Molecular Devices) was made by a chlorided silver wire. An electrode holding potential of +650 mV versus an Ag/AgCl reference electrode was applied by the Axopatch 200A after appropriate modification to the holding potential circuitry (Molecular Devices Hardware Modification Note #22). Sensitivity of the electrode was checked with current measurement in response to 50 μm DA reconstituted from 10 mm stock solution in 100 mm perchloric acid. The output of the Axopatch 200A was filtered at 2 kHz by an internal eight-pole low-pass Bessel filter. Sampling frequency was 6.7 kHz. The amount of DA was estimated to be equivalent to two electrons per oxidized DA molecule.
To stimulate release of GABA and DA, ECl was set near −60 mV, the holding potential was −90 mV, and 3 s depolarizing pulses to −10 mV were delivered to the DAergic cell bodies. To rule out the possibility that the coincidence of GABA and amperometric events was attributable to chance, we performed a Monte Carlo simulation under the null hypothesis of independence between the timing of GABA current events and that of the amperometric current events, because the release of DA and GABA were both based on a Poisson process (see Results). For each depolarization trial, we measured the times of the last events of GABA release (t = Tg) and DA release (t = Td) after the onset of depolarization (t = 0) and counted the number of GABA (Ng) and DA (Nd) events. The times of the Ng GABA events were uniformly distributed on (0,Tg), and the times of the Nd DA events were uniformly distributed on (0,Td). So, for each trial, under the null hypothesis of independence of GABA and DA events, we simulated the times of the events and computed the number of events that coincided within 4 ms (actual time interval, 3.37 ms). We then summed the coincidences over the 43 trials. This computation was repeated 10,000 times.
For analysis of the time course of GABA and DA events, data were subsequently low-pass filtered at 100 Hz by digital Gaussian filter (Clampfit 8.1; Molecular Devices), which distorted the 10–90% step rise time to 3.4 ms. After this filtration, threshold for detection of GABA events became 50 pS amplitude, which corresponds to ∼5000 molecules based on a mathematical model of GABAA receptor-mediated Cl− currents over the area surrounding the release site (Hirasawa et al., 2009). Both types of current events were detected by eye with the threshold defined as three times the value of the SD of baseline noise. Statistical values are given as mean ± SD; confidence limits were determined by Student's t tests.
The sensitivity of the techniques used to detect DA and GABA was estimated in the following way. In amperometry, the oxidizing reaction of DA on the carbon surface occurs after one-dimensional diffusion from the releasing pore. Because the time course of DA oxidation is almost instantaneous at a very positive potential (+650 mV), the shapes of oxidative current spikes observed should closely resemble those predicted for instantaneous point source release. The time integral Q of the current transient I can be directly related to the amount of oxidized transmitter by Faraday's law: Q = ∫Idt = Men, where M is the number of molecules, e is the elementary charge, and n is the number of moles of electrons transferred per mole of transmitter oxidized. Threshold for the detection of DA events was 1 fC in charge, corresponding to ∼3000 molecules.
In the patch-clamp experiments, when GABA molecules released from the fusion pore arrive at GABA receptors surrounding the release site, the elementary GABA current ΔI through a membrane unit surface ΔS is determined by the local concentration of GABA, the density of the GABAA receptor Cl− channels, the single-channel conductance, and the receptor binding affinity. The three-dimensional diffusion of GABA molecules is assumed to occur on the plane. The total current I over the area of the plasma membrane surrounding the release site is thus given by the following form: Ι = γVv ∯ p(c)dS, where γ is the single-channel conductance, V is the driving force of Cl−, v is the surface density of the GABAA receptors, and p(c) is the dose–response function that represents the open probabilities of GABAA receptor channels at the GABA concentration c (Hirasawa et al., 2009). Threshold for the detection of GABA events was 50 pS in amplitude corresponding to ∼5000 molecules.
Confocal microscopy.
To investigate the localization of VMAT2 and VGAT in the cell bodies of the DAergic amacrines, the wild-type mice were anesthetized by intraperitoneal injection of a 0.1 ml solution containing equal parts of 5% ketamine (Ketaset; Bristol-Myers Squibb) and 1% xylazine (Rompun; Bayer). The eyes were enucleated and opened at the equator, and their posterior segments were immersed in 2% formaldehyde (Tousimis) in 0.15 m Sörenson phosphate buffer, pH 7.4. Neural retinas were separated from the pigment epithelium and the outer ocular tunics, and kept in the fixative fluid for 2 h at room temperature.
For confocal microscopy, fixed retinas were washed in PBS, cryoprotected in 20% sucrose in PBS, frozen in the liquid phase of partially solidified monochlorodifluoromethane, and finally cut in a cryostat at a thickness of 10 μm. Sections were preincubated for 2 h in blocking solution, containing 2% bovine serum albumin (BSA; Sigma-Aldrich), 10% normal goat serum (catalog #S-1000; Vector Laboratories), and 2% cold water fish gelatin (Ted Pella), and incubated overnight at room temperature in a mixture of rabbit polyclonal α-VMAT2, guinea pig polyclonal α-VGAT, and sheep polyclonal α-TH antibodies (for source and characterization, see Table 1). Slides were washed in several changes of block solution, followed by 3 h incubation in a mixture of donkey α-rabbit, goat α-guinea pig, and donkey α-sheep secondary antibodies (all from Invitrogen), respectively conjugated to Alexa Fluor 568 (catalog #A10042), Alexa Fluor 488 (catalog #A11073), and Alexa Fluor 680 (catalog #A21102). All secondary antibodies were diluted 1:500 with block solution. The retinas were finally rinsed in several changes of PBS and mounted in Vectashield (Vector Laboratories).
Properties of the antibodies used for immunocytochemistry
Fluorescence was detected in a Carl Zeiss LSM 510 Meta confocal imaging system, equipped with three visible wavelength lasers, META spectral emission detectors, and a Carl Zeiss Axioplan 2 microscope. We used a 100× Plan-Apochromatic objective, 1.4 numerical aperture, and set the pinhole at 1 Airy unit for each of the three wavelengths (543, 488, and 633 nm). Eighteen micrographs were obtained sequentially from the three channels by averaging 16 scans (1024 × 1024 pixels) and stored as TIFF files.
Using the NIH ImageJ 1.40 g morphometric analysis tool, in each confocal micrograph of the DAergic cell bodies, the green (VGAT), red (VMAT2), and blue (TH) channels were split, thus converting them into grayscale images. By drawing the contours of the cell and nucleus in the TH image, the cytoplasm was selected, and the intensity of all its pixels was obtained in both green and red images. The images were thresholded on the basis of the distribution profile of the pixel intensities; then, pixels whose intensity was above that of the background were assigned value 1 (top 55% of the green pixels and 43% of the red pixels, a difference caused by the higher background of the staining with the VGAT antibody), and the remaining pixels were given a value of 0. It must be noted that our approach was biased on the side of a false null hypothesis (i.e., concluding independence between green and red; see below).
Because the largest diameter of the organelles stained green, red, or yellow was five pixels, we considered independent of one another any two pixels separated from each other by a distance (vertical or horizontal) of five plus one pixels. Therefore, in the arrays of digitized pixel intensity values of each red and green image, we selected every sixth pixel in both rows and columns (subset 1). We then shifted by (1, 1) the selected pixels five times in the rows and five times in the columns, creating a total of 25 subsets of data for each red and green image (Bianchetta et al., 2005). We repeated this procedure for all 18 micrographs of DAergic cell bodies.
In each subset, the overlap of green and red was then calculated by multiplying the two digitized values for each pixel, i.e., only pixels with a value of 1 in both the red and green arrays were assigned a value of 1. The numbers of double positive, green only, red only, and double negative pixels were counted in each of the subsets, and the data were arranged into 450 contingency tables.
We calculated the odds ratio (OR) in each contingency table and tested the null hypothesis that the true OR was equal to 1, i.e., green in a red pixel had the same probability as green in a pixel that was not red. OR provides a reasonable estimate of the strength of the association when the number of positive pixels is small compared with the number of negative pixels. We modeled the binary outcome of green using logistic regression, with adjustment for the binary outcome of red. We estimated SEs and confidence intervals using the method of generalized estimating equations (Liang and Zeger, 1986) to adjust for dependence among the 25 subsets within each of the 18 micrographs.
Electron microscopy.
The technique used to identify with the electron microscope the DAergic cell bodies in PLAP-expressing mice was described in detail previously (Gustincich et al., 1997). Briefly, after aldehyde fixation, retinas were incubated in a β-glycerophosphate, alkaline lead citrate solution. They were subsequently postfixed in osmium ferrocyanide and stained en bloc with uranyl acetate. After embedding in low-viscosity Epon and thin sectioning, micrographs were obtained with a Jeol 1200 EX electron microscope.
For electron microscopic immunocytochemistry, retinas fixed in formaldehyde as described above were washed in PBS containing 0.2 m glycine to quench free aldehyde groups, infiltrated with 2.3 m sucrose in PBS for 15 min, and frozen in liquid nitrogen. Cryosections were obtained at −120°C with a Reichert Ultracut S microtome equipped with a FC S cryo attachment (Leica Microsystems) and transferred to Formvar–carbon-coated grids, which were subsequently floated on drops of 1% BSA in PBS (PBS/BSA) on Parafilm (10 min). Both the antibodies and the Protein A-gold (Cell Microscopy Center, Utrecht, The Netherlands) were diluted in 1% PBS/BSA, and the diluted antibodies were centrifuged at 15,000 rpm for 1 min. Grids were transferred sequentially to the following: rabbit polyclonal α-VMAT2 (1:50, 30 min), PBS/BSA (4×), Protein A-gold 15 nm in diameter (1:75, 20 min), PBS (4×), 0.1% glutaraldehyde in PBS (5 min) to denature the α-VMAT2 antibody, PBS/BSA (4×), rabbit polyclonal α-VGAT (1:50, 30 min; Table 1), PBS/BSA (4×), Protein A-gold 10 nm in diameter (1:75, 20 min), PBS (4×), and H20 (double distilled, 6×). Staining with 0.3% uranyl acetate in 2% methylcellulose (Sigma) in H2O for 10 min was performed on ice. Grids were picked up with metal loops, and excess fluid was removed by streaking on filter paper, leaving a thin coat of methylcellulose (blue interference color when dry). Micrographs were obtained in a Technai G2 Spirit BioTWIN transmission electron microscope equipped with an AMT 2k CCD camera.
Results
Electrophysiology
To establish whether DA and GABA were released simultaneously and were therefore contained within the same secretory organelles, we exploited the property of DAergic cell bodies to release extrasynaptically both transmitters (Puopolo et al., 2001; Hirasawa et al., 2009). Retinas of transgenic mice that expressed PLAP under control of a promoter sequence of the gene for TH were dissociated by enzymatic digestion and mechanical trituration. Because PLAP resides on the outer surface of the cell membrane, we could identify the DAergic cell bodies by staining the cell suspension with the monoclonal antibody to PLAP E6–Cy3. We made use of the presence of GABAA receptors over the entire surface of DAergic cell bodies to measure by whole-cell patch-clamp recording the Cl− current activated by the exocytosis of their own GABA (Hirasawa et al., 2009). Simultaneously, we measured the oxidation current of DA by carbon fiber amperometry (Wightman et al., 1991); the inset in Figure 1 illustrates the experimental setup. Beveled carbon fiber electrodes were approximated to the cell surface until contact was established, as indicated by dimpling of the plasma membrane. The recording area, measured electrochemically, was ∼40 μm2 or 6% of the cell surface. Oxidation currents were recorded by applying to the carbon fiber electrode +650 mV versus an Ag/AgCl reference electrode, a potential sufficient to oxidize DA (Hochstetler et al., 2000).

Corelease of GABA and DA by isolated DAergic cell bodies. A, A DAergic cell was depolarized from −90 to −10 mV for 3 s (ECl of approximately −60 mV). Events of GABA release are visible as GABAA-mediated Cl− current transients riding on the slowly declining inward current (black trace). Events of DA release are recorded as amperometric spikes attributable to DA oxidation (red trace). B, Segments of the traces in A are shown at an expanded timescale. Ticks mark the peaks of the GABAergic and DAergic events. At the dotted line, a GABAergic event (top) coincides with an amperometric event (bottom). C, Temporal raster plot of the GABAergic (black ticks) and amperometric (red ticks) events observed in 43 trials in 29 cells. Horizontal bar on top indicates the duration of the depolarization. D, Histogram of the event latencies (black, GABAergic events; red, amperometric events). Inset, Recording configuration: dissociated retinal cells were allowed to settle onto a concanavalin A-coated glass coverslip glued to the bottom of a Petri dish. DAergic cells were identified by staining the outer surface of the cell membrane with a monoclonal antibody to PLAP directly conjugated to the fluorescent dye Cy3. Amperometric recordings were obtained with polyethylene-insulated, carbon fibers 5 μm in diameter (left), and membrane currents were recorded by using the whole-cell configuration of the patch-clamp technique (right).
The release of DA and GABA elicited by depolarization of DAergic cell bodies was characterized previously (Puopolo et al., 2001; Hirasawa et al., 2009). Figure 1, A and B, shows that when (1) ECl was set near −60 mV, (2) the holding potential was −90 mV, and (3) intracellular EGTA was 0.05 mm, a 3 s depolarizing pulse to −10 mV elicited both transient Cl− current events and amperometric events. The Cl− current events were mediated by GABAA receptors, because they were abolished by the antagonists bicuculline and gabazine (respectively, 100 and 20 μm; data not shown; Hirasawa et al., 2009), and the amperometric spikes disappeared when the carbon fiber electrode was held at potentials too low to cause DA oxidation (<100 mV vs the Ag/AgCl reference electrode; Puopolo et al., 2001). We measured 145 GABA and 106 amperometric events in 29 cells, including all events that appeared within 9 s after onset of depolarization (Fig. 1C). Latencies of both types of events, as measured from onset of the membrane depolarization to the occurrence of the first GABA or amperometric current transient, exhibited considerable variability (GABA events, 723 ± 834 ms; amperometric events, 1188 ± 1265 ms). In addition, the duration of the discharge of both types of events was very long (up to almost 9 s) and extremely variable in different trials, as illustrated in Figure 1, C and D. As reported previously (Puopolo et al., 2001; Hirasawa et al., 2009), this considerable variability in latency and duration of the discharge is a property typical of extrasynaptic release compared with synaptic vesicle exocytosis at the presynaptic active zone.
As illustrated in Figure 1B, inspection of the traces revealed that the majority of the GABA and amperometric events were not associated with one another, but a proportion of them appeared to coincide in time. From the raster plot of Figure 1C, we generated a perievent time histogram (Fig. 2A, top) by measuring the time intervals between GABAergic events and the immediately preceding and following DAergic events throughout all 43 trials (n = 402 event pairs; bin width, 4 ms). The histogram peaked at a ±4 ms time window (Fig. 2A, bottom; actual interval, −1.14 to +2.23 ms). We thus concluded that 16% of the amperometric events (17 of 106 events) coincided with GABAergic events, because no peak would have occurred if association between the two types of currents had been completely random. Interestingly, this coincidence rate was close to that observed between serotonin and GABA release events in pancreatic β cells (∼6.3%; Braun et al., 2007) and between catecholamine and neuropeptide release events in chromaffin cells (∼14%; Whim, 2006).
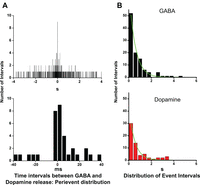
Coincidence of GABAergic and amperometric events. A, Top, Perievent distribution of the intervals between each GABAergic event and the amperometric spike that either preceded or followed the chloride current. Bottom, The peak of the histogram (17 of 106 events) was included within the time window of the ±4 ms bins. Thus, 16% of the amperometric events coincided with GABAergic events, because no peak would have occurred if the association between the two types of currents had been random. B, Both histograms of the time intervals between GABAergic events (black) and DAergic events (red) were fitted with a first-order exponential function and therefore exhibited a Poisson distribution.
The coincidence of GABA and amperometric events, however, could have been attributable to chance. To rule out this possibility, we first observed that the histograms of interevent time intervals for DA and GABA release could be described with a single-exponential fit (Fig. 2B). Therefore, the release of both transmitters was based on a Poisson process, as is the case for the secretion of catecholamines by adrenal chromaffin cells (Chow et al., 1992) and serotonin by leech Retzius cells (Bruns et al., 2000). Then, under the null hypothesis of independence between the two types of events, we performed a Monte Carlo simulation. In 104 trials, the average number of coincidences of GABA and amperometric events was 1.34, and the maximum number of coincidences in any one trial was eight. In no instance we were able to reproduce the 17 coincidences observed experimentally. Therefore, with p < 10−4, there was strong evidence against the null hypothesis of independence of GABAergic and amperometric events. We therefore concluded that the coincidence of DAergic and GABAergic events was not attributable to chance and reflected release of the two types of transmitters from the same organelle.
When we examined coincident GABAergic and amperometric events on an expanded timescale (Fig. 3), we observed that, in approximately half of the pairs (8 of 17), the peak of the amperometric events preceded that of the GABAergic events by 1.14 ± 0.86 ms (Fig. 3A). This was an expected result, because oxidation of the DA released in the area of contact between cell surface and carbon electrode is instantaneous at the very positive potential used (+650 mV), whereas activation of the GABAA receptor channels surrounding the site of exocytosis takes place after radial diffusion of the released transmitter. In the remaining pairs (9 of 17), however, the opposite was true, with the GABAergic events preceding the amperometric ones by 2.23 ± 1.47 ms (Fig. 3B). To compare the rising phases of the two types of events, the currents were averaged, and their times of onset were made to coincide (Fig. 3C, top). In the coincident pairs in which amperometric events preceded the GABAergic events, the rise times of the two currents were remarkably similar after normalization, and, at half-maximal amplitude, the amperometric event preceded by 0.7 ms the GABAergic event (Fig. 3C, bottom). In contrast, when amperometric events followed the GABAergic events, their waveform was quite variable and both their 10–90% rise time and half-width were slower (Fig. 3D, top; Table 2). After averaging, the resulting amperometric trace appeared flattened and irregular in shape (Fig. 3D, bottom). No significant differences in charge and amplitude were observed between the coincident amperometric events that preceded and those that followed the GABAergic events (Table 2).

In each pair of coincident current events, the peak of the amperometric spikes either preceded or followed the peak the GABAergic current. A, Three examples of coincident pairs of GABAergic (black traces) and amperometric (red traces) events obtained from three different cells. The peaks of the GABAergic currents were aligned at 0 ms (dotted line) to show that, in these cases, the peaks of the amperometric events preceded those of the GABAergic events (red ticks). B, In these three examples of coincident pairs, the peaks of the amperometric events (ticks, blue traces) followed those of the GABAergic events (black traces). C, All coincident pairs of GABAergic (black traces) and amperometric (red traces) events in which the amperometric spike came first (n = 8 of 17 pairs) were averaged, and the resulting traces were aligned so that their onsets coincided (arrow). Finally, the two traces were normalized to compare their rise phases. The slopes of the rise times of the two currents were remarkably similar, and, at half-maximal amplitude, the amperometric event preceded by 0.7 ms the GABAergic event. D, The same transformation as in Figure 4C were performed on the pairs of coincident events in which the peak of the amperometric event followed that of the GABAergic event (black, n = 9 of 17 pairs). The averaged amperometric trace (blue) appeared flattened and irregular, suggesting either variability in the distance between release site and carbon fiber electrode or association with very large packets of GABA (see Results).
Properties of the amperometric events that coincided with the GABA current events
In agreement with a previous study (Puopolo et al., 2001), the charge distribution of 89 single and 17 paired amperometric events exhibited a relatively broad-spectrum of sizes, ranging from 1.2 to 39.6 fC or 103 to 105 molecules, assuming that two electrons were transferred for every molecule of DA oxidized (Fig. 4A). The mean charge of coincident amperometric events [10.2 ± 7.5 Q(fC), corresponding to (3.19 ± 2.34) × 104 molecules] and that of single amperometric events [7.3 ± 6.3 Q(fC), corresponding to (2.28 ± 1.97) × 104 molecules] were not significantly different from one another (p < 0.1). Conversely, when we estimated the number of GABA molecules released during the 147 GABAergic events (see Material and Methods), they ranged from 2.0 × 10³ to 3.5 × 10⁶ molecules and therefore exhibited a spectrum of sizes much broader than the amperometric events (Fig. 4B). In contrast with the amperometric events, however, the mean number of molecules of coincident GABAergic events [(6.29 ± 9.86) × 105] was significantly larger than that of single events [(1.64 ± 3.63) × 105 molecules; p < 0.01]. This result was attributable to the fact that a sizable fraction of the GABAergic events exceeding ∼5 × 10⁵ molecules in size (38%) coincided with amperometric events.

Quantum size distribution of the DAergic and GABAergic events. The distribution of the DA quanta (A) ranged from ∼103 to 105 molecules, and the mean size of the coincident events was not significantly different from that of the single events. Conversely, the distribution of the quanta of GABA molecules (B) exhibited a broader spectrum of sizes because it varied from 103 to 106 molecules. The DA quanta associated with the largest GABA quanta were one order of magnitude smaller than the accompanying packet of GABA. Comparison of the distributions of the quantal sizes of DA and GABA shows that both populations, but especially that of the GABAergic events, were skewed toward smaller sizes.
Comparison of the distributions of the quantal sizes of DA and GABA (Fig. 4) shows that both populations were skewed toward smaller events, which is the expected result for the distribution of transmitter contents in populations of cytoplasmic organelles whose diameters are normally distributed. Indeed, all secretory cells that undergo exocytosis, including DAergic neurons, exhibit a similar, normal distribution of organelle diameters and skewed distribution of the volumes of organelles. In addition, however, the population of GABAergic events included a relatively small number of very large transmitter quanta that were probably released during exocytosis of secretory organelles of larger diameter. Indeed, the bodies of DAergic cells, when examined with the electron microscope, contained a small number of moderately dense granules up to 0.3–0.5 μm in diameter (Fig. 5). When the released DA was associated with the large quanta of GABA, the number of monoamine molecules was one order of magnitude smaller than that of the bolus of GABA. Furthermore, the DAergic event was often polymorphic, and its peak followed that of the GABAergic event. This distortion of the amperometric events was caused by either non-uniform contents of the large secretory organelles or “diffusional filtering,” i.e., radial diffusion of the DA from a site of exocytosis situated at some distance from the carbon electrode.

The cell body of DAergic cells contains a polymorphic population of secretory organelles. This micrograph illustrates a detail of the perykarion of a DAergic cell from the retina of a transgenic mouse whose catecholaminergic neurons express PLAP under control of a promoter sequence of the TH gene. Because PLAP resides on the outer surface of the plasma membrane (PM), moored to the bilayer by a glycosylphosphatidylinositol anchor, the intercellular space surrounding the DAergic cell body contains the electron-dense lead phosphate precipitate of the histochemical reaction for alkaline phosphatase. The PLAP reaction product is also present within the cisterns of the Golgi complexes. Unlabeled vesicles (V) and LDCVs are associated with the trans-Golgi network (inset) or scattered throughout the cytoplasm. In addition, the cell contains moderately dense secretory granules (Gr), 0.3–0.5 μm in diameter, and labeled vesicular and tubular profiles (stars), which are probably destined to fuse with the cell membrane. Any of these organelles may possess VMAT2 and VGAT in their membrane and contain variable mixtures of the two transmitters, which are ultimately released at the cell surface by exocytosis.
Confocal microscopy
To identify GABAergic and DAergic organelles in DAergic cells, we obtained confocal images of cryostat sections of formaldehyde-fixed retinas from wild-type C57BL/6J mice after triple staining with antibodies to TH, VGAT, and VMAT2 (Fig. 6A). We focused our attention to the perikaryon of DAergic cells, because their synaptic endings were densely stained by both antibodies (Contini and Raviola, 2003) and individual organelles could not be resolved. All cell bodies stained by α-VMAT2 antibody also contained TH and therefore were DAergic cells, because, in the C57BL/6J mouse retina, type 2 catecholaminergic amacrines are TH negative (Contini et al., 2010). Organelles stained by the transporter antibodies were scattered throughout the cytoplasm of DAergic cells: after image thresholding, they measured from one to five pixels in diameter (equivalent to 0.3–1.4 μm), and, when the blue channel (TH) was eliminated, their staining was green (VGAT), red (VMAT2), or varying combinations of the two colors (Fig. 6B–D). This seemed to indicate that this heterogeneous population of organelles had bound varying amounts of the two antibodies and that a proportion of them contained both transporters.

DAergic cell bodies contain organelles stained by antibodies to VMAT2 and VGAT. Confocal micrographs of a cryostat section of the retina: all three channels are merged in A. The red and green channels, in turn, are merged in B and presented in isolation in C and D. The perikaryon of a DAergic cells is positive for TH (blue). The cytoplasm contains organelles that are exclusively stained for VMAT2 (red, double arrow) or exclusively stained for VGAT (green, single arrow). Some organelles are stained for both and therefore appear various shades of yellow (circle). The contours of both nucleus and cytoplasm were marked in the TH image (inset in A), and the intensity of all pixels of the cytoplasm in both the green (VGAT) and red (VMAT2) images was determined. The strength of the association of green and red in any given pixel was measured by applying OR statistic and logistic regression models. We found that the probability for green and red to be associated in a given pixel was 2.71 times the probability for the pixel to be exclusively green. Thus, the association of VGAT and VMAT2 was not attributable to chance.
We digitized the intensity of all pixels in the green and red images of the cytoplasm of 18 DAergic cell optical sections and used OR statistics to measure the strength of the association between the two transporters. In this way, we forfeited the chance to count stained organelles (1) to avoid subjective bias in estimating the relative green and red staining intensity of the organelles that bound both antibodies and (2) rule out the possibility that colocalization of the two transporters was attributable to the superimposition of different organelles within the thickness of the optical section. The null hypothesis was that the true OR was equal to 1, i.e., green in a red pixel had the same probability as green in a pixel that was not red. OR provides a reasonable estimate of the strength of the association between green and red when the number of positive pixels is small compared with the number of negative pixels. Hypothesis testing was done by using two different methods based on logistic regression models, both adjusting for dependence among the pixels within each organelle (see Material and Methods) and calculated the analytical confidence interval. The lnOR was estimated to be 1.09 with a 95% confidence interval (0.82, 1.4). This means that there was dependence between green and red because, under independence, the lnOR would have been 0. The probability of (green in a red+ pixel) divided by the probability of (green in a red− pixel) was 2.74, i.e., there was 2.74 times the likelihood for a green pixel of being red+ than being red−. Under independence, the ratio would have been 1. We could therefore rule out that the colocalization of VGAT and VMAT2 in a number of the cytoplasmic organelles of DAergic cells was attributable to biased sampling or chance superimposition. Statistical simulation showed that inclusion of additional micrographs was unnecessary.
Electron microscopy
To resolve individual organelles in the axonal endings of DAergic cells, formaldehyde-fixed retinas were treated sequentially with α-VMAT2 and α-VGAT antibodies, followed by Protein A conjugated to 15 and 10 nm gold particles, respectively (Fig. 7). Both antibodies were rabbit polyclonals, because they strongly bind Protein A; we therefore crosslinked with glutaraldehyde the residual epitopes of the first antibody before the application of the second one. We focused our attention to the most scleral stratum of the inner plexiform layer, in which synaptic endings of DAergic cells are very frequent and can be readily identified because they are the only processes in which synaptic vesicles are labeled with antibodies to VMAT2. In the clusters of negatively stained synaptic vesicles, the majority of the 15 and 10 nm gold particles were scattered individually. Less frequently, however, particles of different sizes occurred in pairs, very close to one another, and either superimposed over or apparently associated with adjacent agranular vesicles (Fig. 7A). The crowding, however, of the vesicle clusters did not permit to rule out completely the possibility that the members of the pairs were bound to separate vesicles that overlapped within the thickness of the cryosection. LDCVs were also occasionally positive for both VMAT2 and VGAT (Fig. 7B).

Electron microscopic immunocytochemistry on retinal cryosections. Cryosections of formaldehyde-fixed retinas were treated with α-VMAT2 and α-VGAT antibodies conjugated to gold particles of different diameters. A, In this electron microscopic image, a synaptic ending situated in the most scleral stratum of the inner plexiform layer contains a cluster of negatively stained synaptic vesicles that are labeled by both 15 nm (VMAT2) and 10 nm (VGAT) gold particles. This ending belongs to a DAergic cell because, in C57BL/6J mice, only this amacrine cell type contains VMAT2+ vesicles. Note that gold particles of either diameter are scattered individually throughout the ending. In the center, however, two 15 nm particles and one 10 nm particle (double arrow) are very close to one another and apparently associated with a single vesicle. B, A cluster of LDCVs is labeled for both VMAT2 and VGAT. A pair consisting of a 15 and a 10 nm gold particle (double arrow) is associated with a single LDCV.
Discussion
Combined amperometric and patch-clamp recordings from acutely isolated perikarya of DAergic amacrine cells detected events of GABA and DA release during membrane depolarization. Previous evidence had shown that this release was attributable to exocytosis, because the events were transient on the millisecond timescale and were Ca2+ dependent (Puopolo et al., 2001; Hirasawa et al., 2009). The majority of the release events of one transmitter were unaccompanied by the release of the other, but a significant number of them were simultaneous. Confocal microscopy of intact retinas showed that the perikarya of DAergic cells contained organelles that bound antibodies to both vesicular transporters: some organelles were immunoreactive for VGAT or VMAT2 alone and others for variable mixtures of both transporters, which suggests variable contents of DA and GABA. Together, these data strongly support the idea that a proportion of the secretory organelles in the cytoplasm of DAergic cells bodies contain both GABA and DA and release them simultaneously by exocytosis during depolarization of the cell membrane.
We cannot provide a precise estimate of the extent of the colocalization of the two transmitters within the population of
somatic secretory organelles: in amperometry, the contact area between carbon electrode and cell membrane was ∼ of the total body surface, whereas the patch electrode measured GABA release over the entire surface. Amperometry indicates
that a proportion of the secretory organelles contain DA in absence of detectable amounts of GABA. They likely correspond
to the cytoplasmic organelles that are exclusively VMAT2 positive. Because the carbon fiber only contacts a fraction of the
cell surface, we cannot prove that all GABAergic events that occur in the absence of a simultaneous DA event are caused by
exocytosis of organelles exclusively filled with GABA. They must, however, exist because immunocytochemistry demonstrates
the presence of organelles stained by VGAT alone. If we extrapolate the amperometric data to the entire cell surface, the
total number of DAergic events would be one order of magnitude larger than the number of events of GABA release, and, paradoxically,
the coincident events over the entire cell surface would be twice as many as the recorded GABAergic events. Thus, either amperometry
measured DA release from a surface larger than the tip of the carbon fiber or the release of the smallest packets of GABA
molecules was lost in the noise of the patch-clamp recordings. Indeed, threshold for detection of the GABAergic currents was
an amplitude of 50 pS, corresponding to a GABA quantum of ∼5000 molecules, whereas threshold for the detection of DA was a
charge of 1 fC or ∼3000 molecules (Puopolo et al., 2001). Also noteworthy is the fact that, when DA release was associated with a huge GABA bolus, the monoamine quantum was one
order of magnitude smaller than the concomitant GABA quantum. We have no explanation for this finding: compound exocytosis
such as that seen in pancreatic β cells (Eliasson et al., 2008) is unlikely because, in DAergic cells, secretory granules are few in number and far apart.
What is the identity of the somatic organelles that release GABA and DA? DAergic cells are a typical example of a neuron that synthesizes, in addition to DA and GABA, a large repertory of molecules: these include the neuropeptide cocaine-and-amphetamine-regulated transcript, the hormone insulin, the cytokine interferon-α, and the chemokine monocyte chemoattractant protein-1 (Gustincich et al., 2004). In fact, electron micrographs show that the DAergic cell cytoplasm contains secretory granules, 0.3–0.5 μm in diameter and 100 nm LDCVs, together with a plethora of polymorphic membranous compartments, which can be described as vesicles, tubules, and cisterns (Fig. 5). Our confocal images showed that the organelles that contained VMAT2, VGAT or varying amounts of both transporters exhibited apparent sizes of 0.3–1.4 μm and, therefore, probably corresponded to the granules and LDCVs present in the electron micrographs. It must emphasized, however, that our identification of the immunoreactive organelles was biased toward structures larger that a single pixel. Indeed, the broad spectrum of sizes of the transmitter quanta (103–106) and the fact that both their GABAergic and DAergic populations were skewed toward smaller events indicate that the secretory organelles were highly heterogeneous and had to include a proportion of the small vesicles visible with the electron microscope.
Little is known of the global traffic of all these somatic, membrane-bounded organelles that contain either or both transmitter transporters in their limiting membrane, accumulate DA and/or GABA in their interior, and participate in regulated exocytosis and endocytosis. Apparently, they have acquired at the trans-Golgi network variable mixtures of the two types of transporter molecules and therefore accumulate varying amounts of the two transmitters. In addition, as noted previously (Puopolo et al., 2001), small vesicular profiles may be temporarily docked at the somatic cell surface and undergo multiple cycles of exocytosis and endocytosis, thus recycling their complement of transporter molecules with the plasmalemma.
There is evidence also that synaptic vesicles in DAergic cells may contain both DA and GABA: confocal microscopy had shown colocalization of VMAT2, VGAT, and GABA in the axonal varicosities of DAergic cells (Contini and Raviola, 2003), and we present here electron micrographs of retinal cryosections, suggesting that synaptic vesicles and LDCVs are labeled by antibodies to both transporters. It is interesting that, at DA-to-AII amacrine cell synapses, GABAA but not DA receptors are clustered in the postsynaptic active zone (Contini and Raviola, 2003), an indication that DA, regardless of its site of release (synaptic or extrasynaptic) acts by volume transmission on receptors diffusely distributed over the surface of the postsynaptic targets of DAergic cells.
Colocalization and corelease of two low-molecular-mass transmitters are common in both central and peripheral neurons (Hnasko and Edwards, 2012), but it is still unclear whether they are contained within the same synaptic vesicle, except for GABA and glycine, which are cotransported by VGAT (Wojcik et al., 2006). In interneurons of the tadpole spinal cord, pharmacological dissection of miniature EPSCs showed that part of the synaptic vesicles coreleased glutamate and ACh and the remaining ones released a single transmitter (Li et al., 2004). In contrast, in retinal starburst cells, Lee et al. (2010) suggested that GABA and ACh were contained in separate vesicles. The case of glutamate and GABA is controversial. Two studies, both based on light and electron microscope immunocytochemistry of vesicular transporters, reached opposite conclusions: in the hippocampus, terminals of axons that made both asymmetric and symmetric synapses onto dentate granule cells contained two distinct populations of synaptic vesicles, one positive for VGAT and the other for the glutamate transporter VGLUT2 (Boulland et al., 2009). In contrast, in the cerebral cortex of adult rats, VGAT and VGLUT1 sorted to the same population of vesicles in a subset of axon terminals that formed both symmetric and asymmetric synapses (Fattorini et al., 2009). These discrepancies may be reconciled if one postulates that synaptic vesicles contain variable mixtures of both transmitters. When both transmitters act on ionotropic receptors, the physiological action at the synapse is determined by the nature of the receptors that accumulate in the postsynaptic active zone. Therefore, it is not surprising that a single ending could establish both asymmetric and symmetric contacts on the same postsynaptic cell, as observed in the chick ciliary ganglion (Tsen et al., 2000), hippocampus (Boulland et al., 2009), and cerebral cortex (Fattorini et al., 2009).
A key to explain these results and other apparent discrepancies in the literature is that the synaptic vesicle proteins are continuously exchanged with the presynaptic membrane during multiple events of fusion and recycling. Mechanisms exist to ensure that synaptic vesicles acquire during recycling the entire complement of proteins that are critical to their functional performance. To this purpose, specific motifs in the amino acid sequence of several vesicular proteins, including the transporters VMAT2 and VGLUT1, recruit specific adaptor molecules that shepherd them into the clathrin coat of coated vesicles (Saheki and De Camilli, 2012). Furthermore, specific adaptors appear to address VGLUT1 and VMAT2 to different pools of vesicles in the presynaptic ending (Tan et al., 1998; Voglmaier et al., 2006; Onoa et al., 2010; Hua et al., 2011). It is yet unclear, however, whether such mechanisms are stringent enough to ensure identical complement of transporter molecules to each synaptic vesicle in the axonal endings of neurons that synthesize multiple low-molecular-weight transmitters. In fact, (1) each vesicle can accommodate 9–14 transporter molecules in their membrane (Takamori et al., 2006), (2) transporters are interchangeable, and (3) the presence of a vesicular transporter is sufficient to cause the accumulation of the pertinent transmitter within the vesicle (Takamori et al., 2000, 2001). This suggests that the presence of variable numbers of VMAT2 and VGAT molecules within the membrane of the same vesicle may result from stochastic sorting of the two transporters during recycling from the cell membrane. In a similar manner, the sorting of both VMAT2 and VGAT to the various secretory organelles in the cell body may be determined stochastically at the moment of their budding from the trans-Golgi network or the somatic cell membrane.
Footnotes
- Received May 8, 2012.
- Revision received July 17, 2012.
- Accepted July 26, 2012.
-
This work was supported by National Institutes of Health Grant EY01344 (E.R.) and the Harvard NeuroDiscovery Center and Harvard Catalyst (R.A.B.). We thank M. Ericsson for help with electron microscopic immunocytochemistry, L. Ding and D. Tom for help with the analysis of the confocal images, Dr. R. H. Edwards for his generous gift of the VGAT antibody, and Dr. B. Bean for discussions.
- Correspondence should be addressed to Elio Raviola, Department of Neurobiology, Harvard Medical School, 220 Longwood Avenue, Boston, MA 02115. elio_raviola{at}hms.harvard.edu
- Copyright © 2012 the authors 0270-6474/12/3213281-11$15.00/0




