Figure 6.
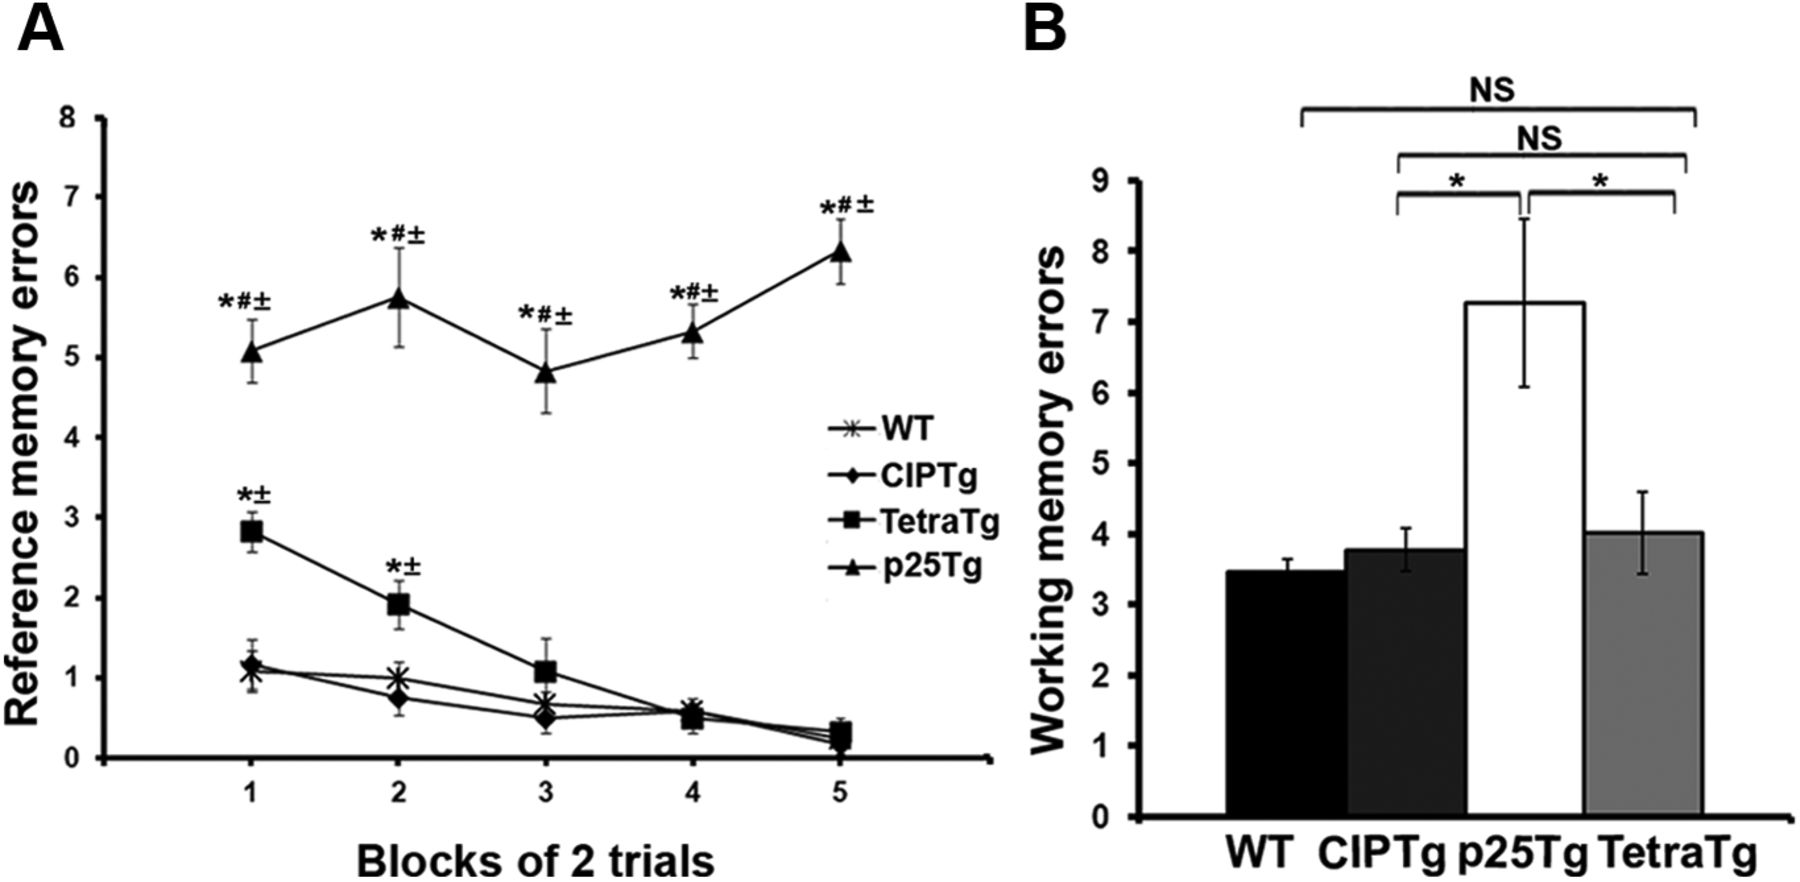
Recovery of p25-induced neurocognitive deficits in TetraTg mice. A, Graphical representation of reference memory errors (8-arm radial maze performance) made by mice groups. Data points show mean reference memory errors in blocks of two trials [p < 0.0001 between the groups (repeated-measures ANOVA), *p < 0.05 compared with CIPTg, #p < 0.05 compared with TetraTg, and ±p < 0.05 compared with WT mice (Student's t test)]. B, Graph shows the working memory errors made by mice groups. Columns represent mean working memory errors from 10 sessions (*p < 0.01, one-way ANOVA, followed by Tukey's test). n = 6 mice for each group. Error bars indicate ±SEM.


