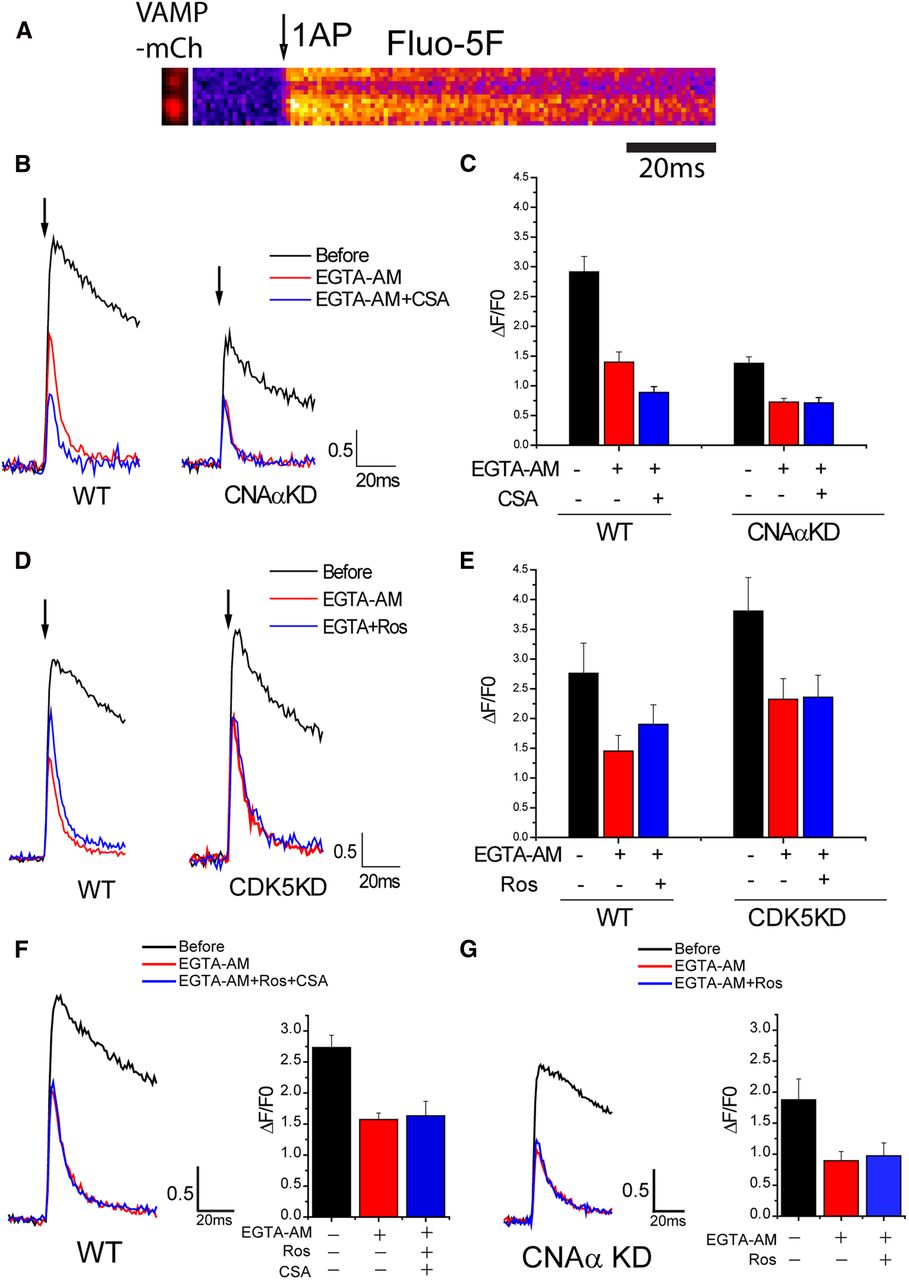
CNAα and CDK5 regulate AP-stimulated Ca2+ influx at nerve terminals. A, Representative images of VAMP2–mCh and its corresponding Fluo5F kymograph image for 1AP stimulation in WT. B, Representative 1AP Fluo5F traces before (black) and after (red) EGTA-AM with CSA (blue) in WT (left) and CNAαKD (right) neurons. Arrow indicates 1AP point. C, Mean value of Fluo5F 1AP response amplitudes before and after EGTA-AM with/without CSA in WT and CNAαKD neurons: WTBefore 1AP = 2.92 ± 0.26, WTEGTA-AM 1AP = 1.40 ± 0.17, WTEGTA-AM + CSA 1AP = 0.89 ± 0.10 (n = 8), CNAαKDBefore 1AP = 1.38 ± 0.11, CNAαKDEGTA-AM 1AP = 0.73 ± 0.06, and CNAαKDEGTA-AM + CSA 1AP = 0.71 ± 0.09 (n = 9). D, Representative 1AP Fluo5F traces before (black) and after (red) EGTA-AM with roscovitine (Ros) (blue) in WT (left) and CDK5KD (right) neurons. Arrow indicates 1AP point. E, Mean value of Fluo5F 1AP response amplitudes before and after EGTA with/without roscovitine in WT and CDK5KD neurons: WTBefore 1AP = 2.76 ± 0.51, WTEGTA-AM 1AP = 1.45 ± 0.26, WTEGTA-AM + Ros 1AP = 1.90 ± 0.33 (n = 7), CDK5KDBefore 1AP = 3.81 ± 0.56, CDK5KDEGTA-AM 1AP = 2.32 ± 0.35, and CDK5KDEGTA-AM + Ros 1AP = 2.36 ± 0.37 (n = 8). F, Left, Representative 1AP Fluo5F traces before (black) and after (red) EGTA-AM with Ros and CSA (blue) in WT neurons. Right, Mean value of Fluo5F 1AP response amplitudes before and after EGTA-AM with/without Ros and CSA in WT neurons: WTBefore 1AP = 2.73 ± 0.19, WTEGTA-AM-1AP = 1.57 ± 0.10, and WTEGTA-AM + Ros + CSA 1AP = 1.63 ± 0.23 (n = 5). G, Left, Representative 1AP Fluo5F traces before (black) and after (red) EGTA-AM with Ros (blue) in CNAαKD neurons. Right, Mean value of Fluo5F 1AP response amplitudes before and after EGTA-AM with/without Ros in CNAαKD neurons: CNAαKDBefore 1AP = 1.87 ± 0.33, CNAαKDEGTA-AM 1AP = 0.89 ± 0.14, and CNAαKDEGTA-AM + Ros 1AP = 0.97 ± 0.20. (n = 5).


