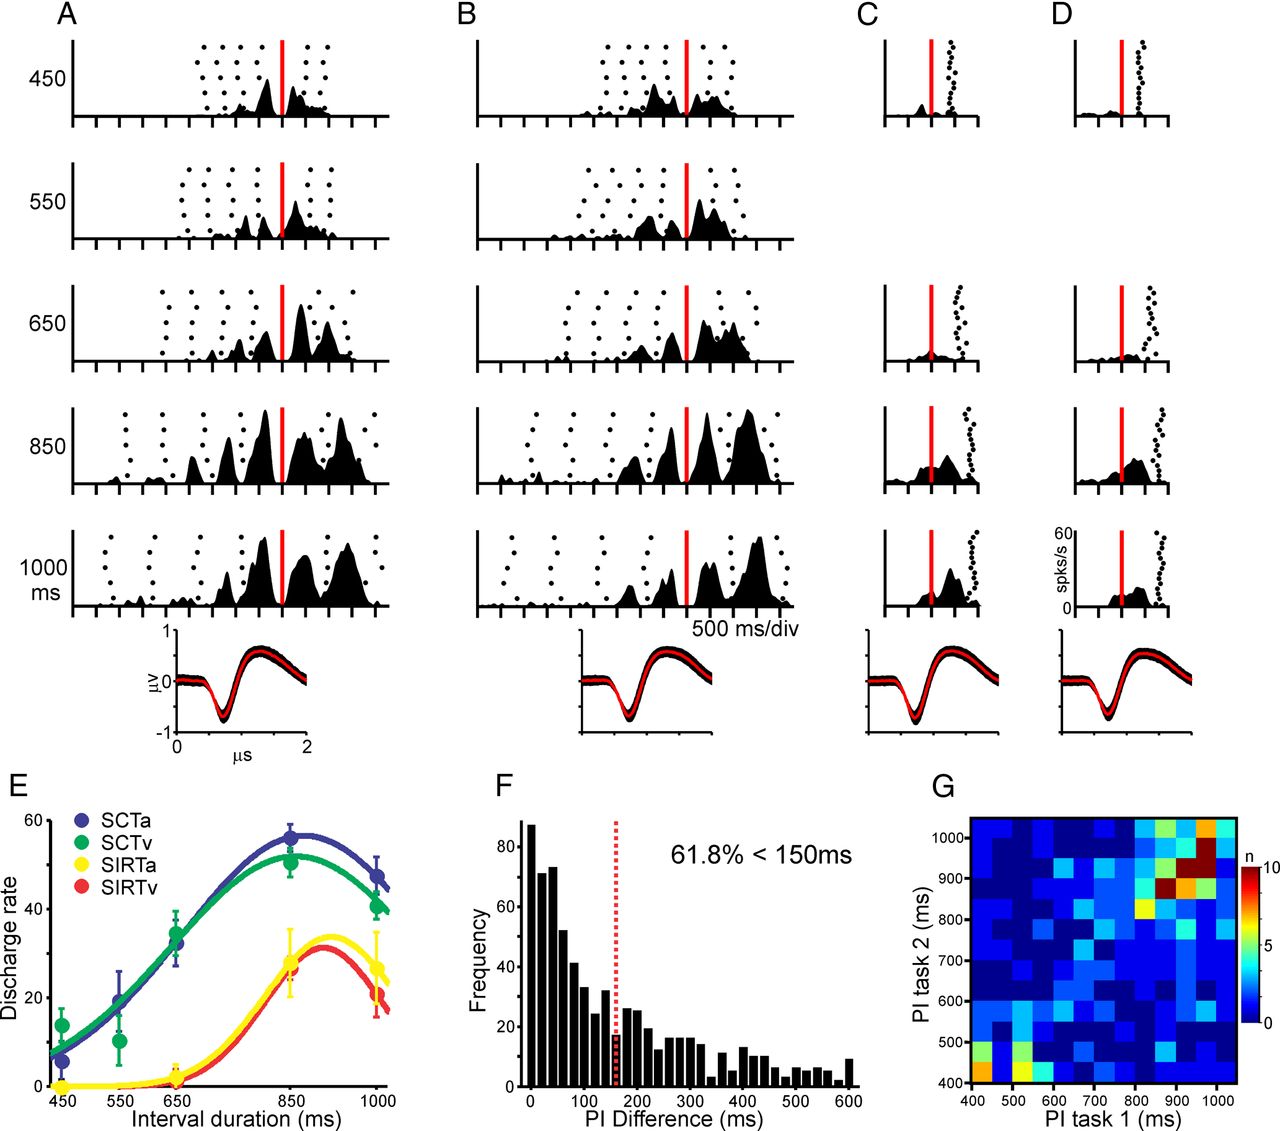
Interval tuning across tasks and sensory modalities. A–D, Average spike-density functions of the responses of an interval-tuned cell with a long preferred interval across different temporal contexts. The mean (red curve) and SD (black area) of the action potential waveform during each task combination is shown at the bottom. A, SCT in the auditory condition. B, SCT in the visual condition. C, SIRT in the auditory condition. D, SIRT in the visual condition. In A and B, the raster histograms are aligned (red line) to the first tap of the continuation phase, whereas in C and D, they are aligned to the first tapping movement. E, Tuning functions for the cell in A–D, where the mean ± SEM of the discharge rate is plotted as a function of the target interval. The continuous lines correspond to the significant Gaussian fits. SCTa, Auditory SCT (blue); SCTv, visual SCT (green); SIRTa, auditory SIRT (yellow); SIRTv, visual SIRT (red). F, Distribution of the PI difference for the cells tuned during different task pairs. The Dotted red line corresponds to the 150 ms PI difference. G, Density plot of the PIs for the same cells between all possible combinations of task pairs (task 1 vs task 2). The color code represents the number (n) of cells with different PI combinations between tasks.


