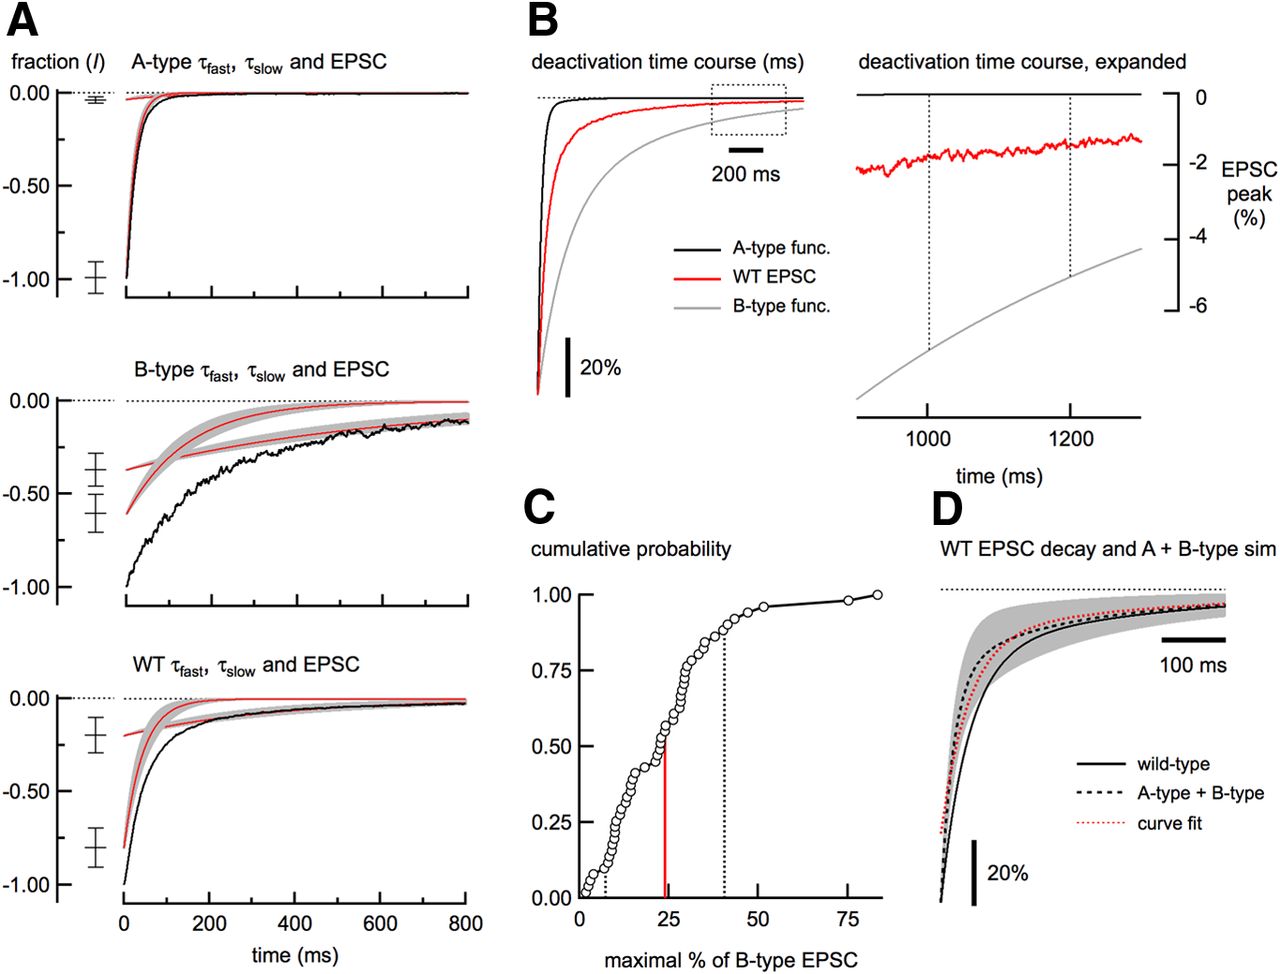
Deactivation kinetics of NMDA receptor-mediated EPSCs. A, Fast and slow time constants (τfast and τslow) from fitting the A-type, B-type, and wild-type (WT) neuron EPSC deactivation are plotted individually (red traces) ± 1 SD (gray regions). The relative contributions ± 1 SD of each time constant are shown at left. The black traces represent the EPSC deactivation from a representative neuron from each cell type. For each group, n = 35 neurons. B, Traces on the left show the superimposed and peak-scaled two-exponential functions using the mean deactivation parameters from A-type EPSCs (black trace) and B-type EPSCs (gray trace). The deactivation from a representative wild-type EPSC is plotted in red. The plot on the right shows that at 1000 ms after the peak, the A-type EPSC has returned to baseline, whereas EPSCs from wild-type and B-type neurons contribute a small amount of current at this long latency. The dashed rectangle on the left shows the region indicated in the plot on the right. Dashed lines indicate the range (200 ms) over which the amplitude measurement was made. C, Cumulative distribution of the estimate of the maximum amount of B-type current in the wild-type EPSCs (n = 51). The mean (red line) and 1 SD (dashed lines) are shown. D, Black trace shows the plot of a two-exponential function using the mean parameters from wild-type EPSC deactivation superimposed on a simulated EPSC deactivation made from the sum of B-type and A-type exponential functions (gray) ± 1 SD (gray region). The black dashed line shows the mean (23.9% B-type plus 76.1% A-type). The red trace is the fit of the mean, constrained with the mean τfast and τslow from wild-type EPSCs. Note that ∼20% of the simulated EPSC deactivation could not be fit with these parameters.


