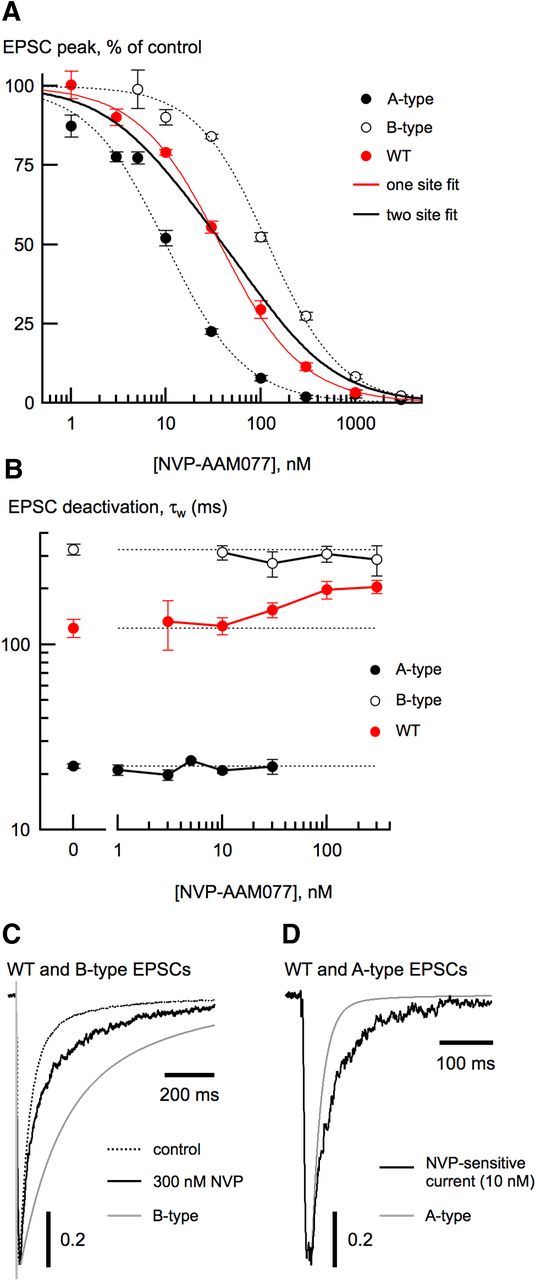
Using a competitive antagonist to separate NMDA receptor subtypes. A, NVP-AAM077 dose-inhibition curves from A-type (closed circles), B-type (open circles), and wild-type (WT; red circles) EPSCs. Data from all neuron types were well fit with a single site isotherm (see Materials and Methods). Fits to data from A-type and B-type EPSCs are shown with dashed lines. The single-site isotherm fit of the wild-type EPSC dose-inhibition data (red trace) was much better (χ2 = 0.34) than a fit using a two-site isotherm (χ2 = 6.71) with the IC50 values from A-type and B-type EPSCs and the contribution of each unconstrained (black trace). For this fit, the fractional contribution from B-type receptors was 0.54 ± 0.07. Each NVP concentration represented the mean reduction from 4 to 14 neurons from each of the three cell types. B, τw from A-type, B-type, and wild-type neuron EPSCs as a function of NVP concentration. As expected, τw of wild-type EPSCs increased with increasing NVP concentration, consistent with selective elimination of A-type receptors. Note that τw of wild-type EPSCs never became as slow as τw from B-type EPSCs. C, At high NVP concentration, the wild-type EPSC deactivation (black trace) was still slower than the mean B-type deactivation (gray trace). D, In wild-type neurons, the deactivation of the current resulting from subtracting the EPSC in 10 nm NVP (black trace) from the control EPSC is slower than the mean A-type EPSC deactivation (gray trace).


