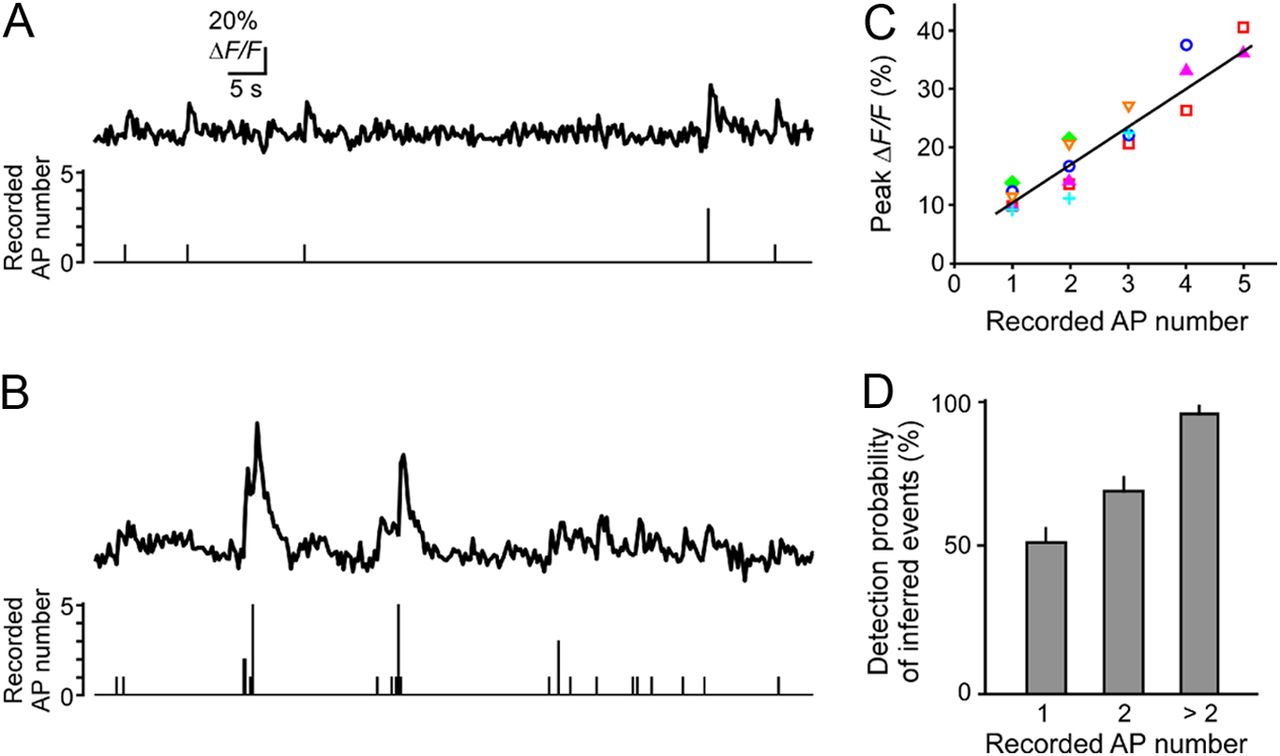
Relationship between calcium transients and firings. A, B, Example traces of simultaneous two-photon imaging and cell-attached recordings from two different cells. Top traces show the fluorescent traces of the attached cell somas. Bottom traces show the number of recorded APs from an attached cell between two flanking imaging time points. C, Peak ΔF/F as a function of the number of recorded APs. The number of APs between two flanking imaging time points and the peak ΔF/F at the latter imaging time points were compared for every time point. Different colored symbols indicate the mean peak values for each number of APs from individual cells (n = 6 cells from two mice). A regression line for all points is shown. Spearman's rank correlation coefficient was 0.94. D, Detection probability of inferred events for each recorded AP number.


