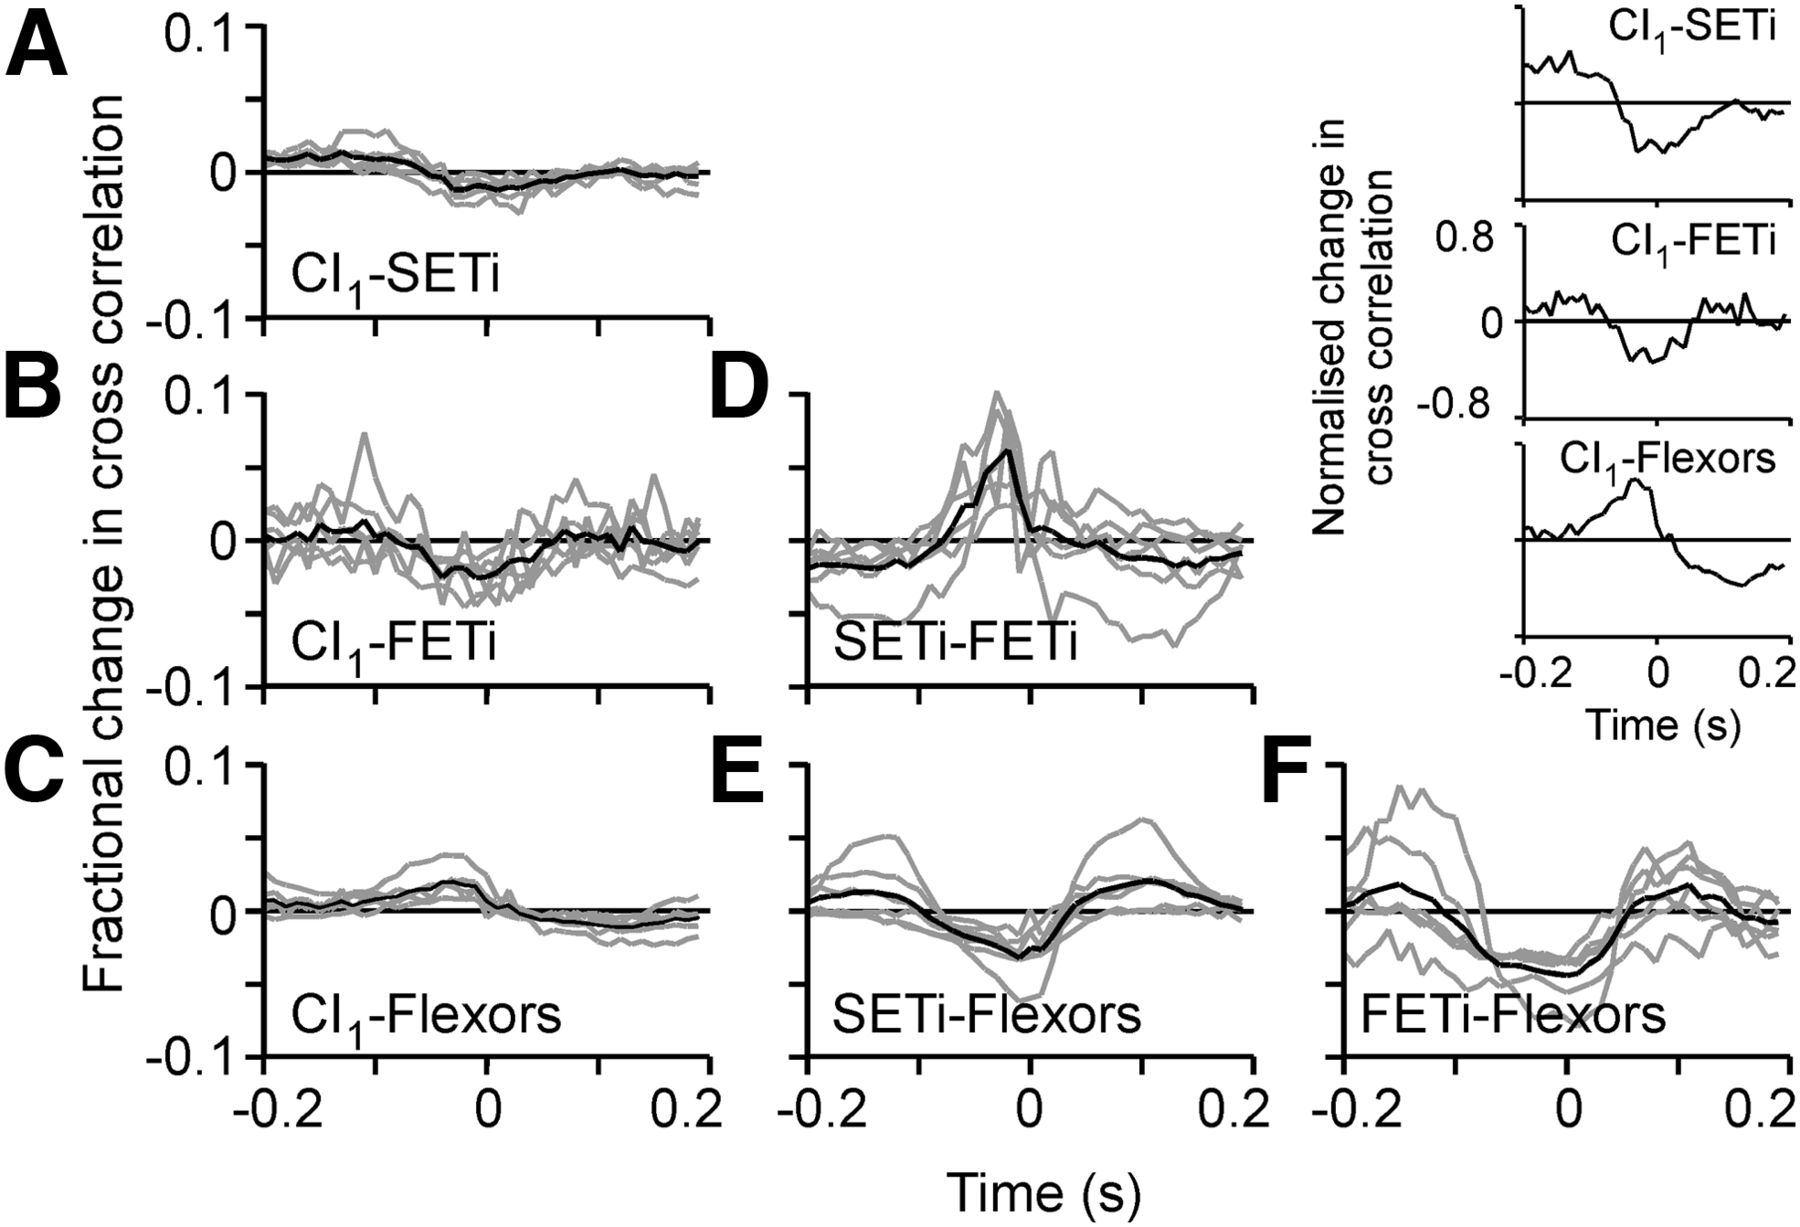
Patterns of excitatory and inhibitory motor activity were related during aimed scratches. Cross-correlations were computed for all combinations of motor activity (see Materials and Methods), and the resulting curves for each of the animals were overlaid (gray curves in A–F, N = 6 animals). For each combination, a mean curve was also computed (black curves in A–F). A, CI1 versus SETi. B, CI1 versus FETi. C, CI1 versus flexor motor neurons. D, SETi versus FETi. E, SETi versus flexor motor neurons. F, FETi versus flexor motor neurons. To emphasize the temporal relationships between activity of CI1 and each of the other motor neuron recordings, the individual cross-correlation plots were also normalized to a peak-to-peak amplitude of 1 and centered before being averaged across animals (inset).


