Gamma Deficits as a Neural Signature of Cognitive Impairment in Children Treated for Brain Tumors
-
Author contributions: C.D. and D.J.M. designed research; C.D. performed research; F.W. contributed unpublished reagents/analytic tools; C.D., F.W., and D.J.M. analyzed data; C.D., E.B., and D.J.M. wrote the paper.
Abstract
Cognitive impairment is consistently reported in children treated for brain tumors, particularly in the categories of processing speed, memory, and attention. Although tumor site, hydrocephalus, chemotherapy, and cranial radiation therapy (CRT) are all associated with poorer function, CRT predicts the greatest deficits. There is a particularly high correlation between CRT and slowed information-processing speed. Cortical gamma-band oscillations have been associated with processing behaviorally relevant information; however, their role in the maintenance of cognition in individuals with processing deficits is unclear. We examined gamma oscillations using magnetoencephalography (MEG) in children undergoing CRT to test whether gamma characteristics can be a signature of cognitive impairment in this population. We collected resting-state data as well as data from baseline and active periods during two visual-motor reaction time tasks of varying cognitive loads from 18 healthy children and 20 patients. We found that only high-gamma oscillations (60–100 Hz), and not low-gamma oscillations (30–59 Hz), showed significant group differences in absolute power levels. Overall, compared with healthy children, patients showed the following: (1) lower total high-gamma (60–100 Hz) power during the resting state, as well as during task-related baseline and performance measures; (2) no change in gamma reactivity to increases in cognitive load; and (3) slower processing speeds both inside and outside MEG. Our findings show that high-gamma oscillations are disrupted in children after treatment for a brain tumor. The temporal dynamic of the high-gamma response during information processing may index cognitive impairment in humans with neurological injury.
- brain tumor
- children
- cranial radiation therapy
- gamma oscillations
- magnetoencephalography
- visual-motor
Introduction
Much has been made about the promise of using neuroimaging markers to measure the nature, extent, and prognosis of cognitive impairment in the injured brain (Greicius, 2008; Broyd et al., 2009; Colonnese and Khazipov, 2012). However, the neural mechanisms of impaired information processing, a core deficit after many forms of brain injury (Anderson and Arciniegas, 2010; Dockree and Robertson, 2011; Padovani et al., 2012; Taylor, 2012), are unclear. We propose that gamma oscillations may be an excellent marker of cognitive health and impairment in children.
The rhythmic firing of groups of neurons produces cortical oscillations that can be characterized by their latency and power at specific frequencies. Changes in these characteristics are observed in response to external stimuli or internal processes. Gamma oscillations (30–100 Hz) are particularly associated with cognitive function, as follows: increases in gamma power correlate with faster reaction times (Jokeit and Makeig, 1994; Schadow et al., 2009) and enhanced response accuracy (Kaiser et al., 2009); gamma latencies correlate with cognitive performance (Jokeit and Makeig, 1994; Haig et al., 2000; Martinovic et al., 2007; Schadow et al., 2009); and gamma power increases during attention (Müller et al., 2000), learning (Miltner et al., 1999), and memory (Tallon-Baudry et al., 1998; Lutzenberger et al., 2002) processes, as well as during increased cognitive demand (Mainy et al., 2007; Gaetz et al., 2013).
Cognitive deficits are consistently reported in children treated for brain tumors (Mulhern et al., 1999; Reddick et al., 2003; Merchant et al., 2005, 2009; Mabbott et al., 2006; Liu et al., 2007). Of tumor and treatment variables, cranial radiation therapy (CRT) is most predictive of the severity of these deficits (Askins and Moore, 2008; Winick, 2011). Children treated for brain tumors, including CRT, show slower stimulus response times (Schatz et al., 2000a); delayed motor responses (Berger et al., 2005; Mahone et al., 2007); and deficits in attention, learning, and memory (Mabbott et al., 2008, 2009; Riggs et al., 2014). Furthermore, these children demonstrate slower neural processing speeds and irregular cortical activations in EEGs (Uberall et al., 1996) and functional abnormalities in fMRI (Zou et al., 2005). As such, these children are an excellent population in which to test the critical role of gamma power in cognitive impairment following brain injury.
We recently reported greater relative gamma reactivity in visual and motor regions and corresponding slowed reaction times during simple visual-motor task performance in children undergoing CRT for brain tumors than healthy children (Dockstader et al., 2013). Relative gamma increases in patients could reflect compensation for an inherent gamma deficit where relatively greater gamma was required for task performance. Alternatively, this population could exhibit abnormally high gamma levels that interfere with efficient task performance. To better understand the nature of the gamma dynamic in these patients, we measured absolute gamma power levels in the resting state and during task performance in two tasks of varying cognitive load. During task performance, we calculated absolute power during a baseline period before task initiation and the change in absolute power during the task-related active period. We argue that if children undergoing CRT have an overall gamma deficit that relates to cognitive function, then absolute gamma power should (1) be lower in patients in the resting state and during task performance, and (2) correlate with the proficiency of task performance.
Materials and Methods
Participants
Participants were 18 healthy children and 20 children undergoing CRT for pediatric brain tumors at The Hospital for Sick Children. Datasets from the lower cognitive load visual-motor task came from 15 patients and 17 control subjects in our previous study in which we showed group differences in relative gamma responses (Dockstader et al., 2013). Informed consent was obtained by all participants, and the study was approved by the hospital Research Ethics Board. All patients underwent CRT for the treatment of malignant tumors of the posterior fossa (PF) and were seen for >12 months following treatment. Late effects related to radiation typically begin to emerge during this time (Spiegler et al., 2004). Eligible patients were identified through database review, which included those patients in whom PF medulloblastoma or ependymoma had been diagnosed between 2001 and 2009. Patients were not recruited if they had a diffuse brainstem glioma, were receiving palliative care, or had a premorbid history of neurological/learning disability. Of the patients, 15 were treated for medulloblastoma, and 5 for ependymoma. All medulloblastoma patients were treated with surgery, chemotherapy, and cranial-spinal radiation with a boost to the PF. Ten patients with medulloblastoma were treated with reduced dose cranial-spinal radiation (i.e., 2340 cGy), and the remaining 5 patients received standard dose cranial-spinal radiation (i.e., 3600 cGy). All five patients with ependymomas received focal radiation to the PF (5940 cGy), and one patient received adjuvant chemotherapy. Two patients with ependymomas showed recurrent disease, and subsequently received chemotherapy and standard dose cranial-spinal radiation (3600 cGy) with a boost to the surgical bed (5940 cGy). The mean (±SD) ages of participants at the time of testing were as follows: in 18 healthy children, 136.1 ± 41.49 months; in 20 patients, 144.78 ± 30.98 months. There were no significant differences in age or sex between the control group (12 males and 6 females) and the patient group (13 males and 7 females; age: t(36) = 0.71, p > 0.05; sex: X2 (1, N = 38) = 0.012, p > 0.05). All participants were right handed.
Magnetoencephalography recordings
Neuromagnetic activity was recorded using a whole-head 151 channel CTF MEG system located in a magnetically shielded room. Magnetoencephalography (MEG) data were collected continuously at a rate of 1200 samples/s and were filtered at 0.3–300 Hz. Before MEG data acquisition, each patient was fitted with three fiducial localization coils placed at the nasion and preauricular points to localize the position of the patient's head relative to the MEG sensors. Participants lay supine in the MEG room, with their eyes open and fixated on a black cross (2 × 2 cm) presented on a semitransparent screen placed 50 cm from subjects' eyes. Eyeblinks and saccades were monitored with electro-oculograms (EOGs) applied just distal to the lateral canthus of each eye, and one on the left mastoid process. Continuous head movement was monitored with a head-tracking system during data acquisition. An off-line system tracked motion artifacts in the following two ways: (1) where the current position deviated 5 mm from the reference position; and (2) when there was a 5 mm deviation within a single trial. Any trials in which head movement was ≥5 mm were also not included in any analysis (this ended up being <1% of trials for either group). These parameters for detecting and correcting for motion artifact are widely accepted in the MEG pediatric literature (Xiang et al., 2013; Cheyne et al., 2014; Todd et al., 2014). After the removal of above-threshold data, we conducted a head motion analysis and determined that there were no group differences in head motion in any task, as measured by the average fiducial distance from the original head position across a task as well as the average head movement within each trial (all p values were >0.05). Children were monitored through a camera and head movement/EOG/EMG activities displayed on a monitor outside the MEG room. The time points of overt saccades/blinks were marked and visually inspected at a later date. Trials were marked “bad” and removed before analysis for any that contained overt saccades/eye movements occurring from −200 to 0 ms before onset of the visual cue. Moreover, all participants received a brief (∼20 s) trial of each task to ensure that they understood instructions, could comfortably see the screen and the target stimuli, and could comfortably press the response button before data collection. One patient required corrective lenses for the task, and MEG-compatible lenses were made available. Upon completion of MEG data collection, the coils were replaced with MRI-visible markers for coregistration between MEG and MRI information.
MEG tasks
Resting state
Participants were instructed to lie still, keep their eyes open, and fixate on the cross for the duration of a 3 min recording.
Visual-motor reaction time task
Lower load task.
During the task, participants' eyes were open and fixated on a black cross. Their dominant hand was resting at their side with their thumb gently resting on the button of a button box. Pseudo-randomly, every 1.5–2.5 s the black fixation cross was replaced with a green cross accompanied by a static visual contrast grating in the lower visual field. The location and dimensions of this contrast grating have been shown to elicit a strong visual evoked field ∼75 ms after stimulus onset (Koelewijn et al., 2011). Participants were instructed to push the button with their dominant thumb as soon as the green cross appeared. The time of the button press in response to the green cross was recorded as the “reaction time.” Each participant underwent 100 trials.
Higher load task.
This task was similar to the lower load task (LLT); however, every 1.5–2.5 s the black fixation cross was replaced with either a green cross or a red cross accompanied by a static visual contrast grating. Subjects were instructed to press the button as quickly as possible in response to the green cross and to do nothing in response to a red cross. The time of the button press in response to the green cross was recorded as the “reaction time.” There were 197 green crosses and 100 red crosses presented pseudo-randomly. As stimulus discrimination and response selection was required, this task had a higher cognitive load than the lower load task. The presentation order of all tasks was counterbalanced across participants within each group (Fig. 1).

Participants performed two counterbalanced tasks in the MEG: visual-motor reaction-time LLTs and HLTs. In both tasks, participants were to attend to a visual stimulus and respond as quickly as possible when cued. Reaction time was recorded for each trial. Only “Respond” trials were presented for the LLT. For the HLT, Respond trials were presented on 67% of trials, and on 33% of trials a different cue was presented in which no response was required (i.e., “Don't Respond” trials). The HLT involves increase cognitive load versus the LLT, as stimulus discrimination is required. See also Table 1.
Analyses
MEG analyses
MEG data were digitally filtered off-line for low-gamma (30–59 Hz) and high-gamma (60–100 Hz). We divided gamma oscillations into low-frequency and high-frequency bandwidths based on recent evidence that low (<60 Hz) and high (≥60 Hz) gamma-band responses can be dissociated during task performance (Brovelli et al., 2005; Sun et al., 2012; Grent-'t-Jong et al., 2013) and can be differentially affected in populations with cognitive deficits (Sun et al., 2012). Data were also filtered outside the gamma range to ask whether there were any group effects in other bandwidths, as follows: delta (0.5–3 Hz), theta (4–7 Hz), alpha (8–12 Hz), and beta (13–29 Hz).
Resting-state oscillations
Average absolute power—or total power—across 120 s was calculated for a single trial from 30 to 150 s from the onset of the resting state for each channel, within each bandwidth, and across the whole brain (i.e., all channels), as well as regionally for each individual. In the latter, MEG channels were grouped into the following 10 distinct regions: bilateral frontal, temporal, parietal, occipital, and central (Fig. 2A). These regions were based on the work of Bosma et al. (2008). Topographic representations of the power spectrum were created in which each individual pixel on the topoplot represented the value of spectral power for the corresponding local MEG channel.
Task-related oscillations
Whole-brain oscillations (baseline and active periods).
A baseline interval for each bandwidth was calculated as the time period just before the visual cue. The change in absolute power during the active period was then calculated by subtracting series of active windows (following the visual cue) from baseline. The changes in power were averaged across the whole-brain for both LLTs and higher load tasks (HLTs). The corresponding baseline/active time windows were applied: delta (0.5–3 Hz), baseline −600 ms to 0 ms, active time window 0 to 600 ms after visual cue); theta (4–7 Hz), baseline −200 ms to 0 ms, active time windows starting at 0–200 ms after visual cue and every 200 ms following; α (8–12 Hz), baseline −100 ms to 0 ms, time windows starting at 0–100 ms after visual cue and every 100 ms following; beta (13–29 Hz), baseline −75 ms to 0 ms, active time windows starting at 0–75 ms after visual cue and every 75 ms following; gamma (both low and high 30–100 Hz), baseline −30 ms to 0 ms, active time windows starting at 0–30 ms after visual cue and every 30 ms following. These windows were corresponded to the number of oscillations of a particular frequency in 1000 ms. Topographic representations of the power spectrum for each time window were then created.
Regional oscillations.
Using only the bandwidth that showed significant differences in the whole-brain analysis (60–100 Hz), we applied the same analysis described above to each of the 10 topographic regions separately.
Beamformer source localization.
Using only the bandwidth and time windows that showed significant group differences in the topographic, task-related analysis we applied a beamformer method across the entire brain to determine the exact locations of underlying neural generators observed during task performance for each group. Spatial localization was based on the synthetic aperture magnetometry (SAM) approach (Robinson and Vrba, 1999) and automatized through BrainWave software (developed by Dr. Douglas Cheyne, The Hospital for Sick Children, Toronto, ON, Canada). Therefore, data analysis was restricted to a period of 60–100 Hz during the significant active time windows with a baseline period of −30 to 0 ms relative to the visual cue. Images were spatially normalized and registered to a pediatric template (Wilke et al., 2002) using the BrainWave toolbox integrated with Statistical Parametric Mapping software (Wellcome Trust Centre for Neuroimaging, London, UK). A between-group permutation analysis of 512 replications that was thresholded at 0.05 was applied. Talaraich labels were obtained by warping the averaged data fit to a pediatric template to the adult MNI template (ICBM152; Mazziotta et al., 2001). Data were thresholded at a value of 0.1 (pseudo-Z). In particular, sources that corresponded to regional topographic differences were investigated.
Neuropsychological information processing speed scores.
A composite index score for processing speed index (PSI) was calculated based on the processing speed subtests of the Wechsler Intelligence Scale for Children–fourth edition (WISC-IV; Wechsler, 2004). PSI scores were obtained for patients only (during a clinical visit) and within 6 months of MEG testing.
Statistical approach
Resting-state oscillations
A single value for each participant, within each frequency bandwidth, was derived from the averaged absolute power value across all topoplot pixels for each individual's resting-state data. A MANOVA was conducted on the mean absolute power across all six bandwidths with group (patient and control groups) as a between-subjects factor for the whole brain and, separately, for each region.
Reaction time during task
A repeated-measures ANOVA was conducted on the mean reaction time to the cue for the visual-motor tasks, with group (patient and control groups) as a between-subjects factor and task (LLT and HLT) as a within-subjects factor.
Task-related oscillations
Active periods.
Overall, we conducted a series of repeated-measures ANOVAs to test the effects of group, active time windows, and task on whole-brain frequency power and regional frequency power, respectively. For all analyses, significant main effects and lower-order interactions were interpreted in the context of the highest-order interaction that was significant: tests of simple effects—corrected for multiple comparisons (Bonferroni correction) to address type 1 errors—were then used to interrogate the highest-order interaction.
Whole-brain oscillations.
First, we examined group differences in the time course of changes in absolute oscillatory power during the visual-motor LLTs and HLTs across the whole brain for each bandwidth separately. Separate repeated-measures ANOVAs were conducted on mean absolute power for each bandwidth with group (patient and healthy children groups) as a between-subjects factor, and task (LLT and HLT) and time (active time window) as within-subjects factors. Investigation of temporal changes continued up to 600 ms after the visual cue as the average reaction time ± SD fell within this time period for both groups, in both conditions. Only those bandwidths showing whole-brain effects were carried forward in the subsequent analyses.
Regional oscillations.
Second, regionally specific estimates in the time course of changes in absolute oscillatory power in bilateral frontal, central, parietal, temporal, and occipital brain regions were examined for each of the 10 topographic compartments. Separate repeated-measures ANOVAs were conducted on the mean power for each region compared with group (patient and healthy children groups) as a between-subjects factor, and task (LLT and HLT) and time (time window) as within-subjects factors. We then used tests of simple effects (with Bonferroni correction for multiple comparisons) to test for group effects in frequency power in each region, whether or not the overall model was significant. To further reduce the chance of spurious effects, we considered group differences to be significant only if they were evident in clusters that spanned across three or more consecutive epochs.
Baseline period
We conducted post hoc t tests to determine whether there were baseline group differences in total gamma power only for conditions in which changes in task-related gamma power were significantly different between groups.
Source localization.
To localize the neural generators underlying any effects, we applied a scalar beamformer method (i.e., SAM) and we averaged the results by group using the Statistical Parametric Mapping software, as described above.
Correlational analyses.
Finally, only those bandwidths and regions where significant effects were identified in our prior analyses were carried forward to test for the relations between frequency power and information-processing speed in patients. Correlation analyses (with Bonferroni corrections for multiple comparisons) were performed between (1) the regional frequency power for time epochs from the LLT and HLT performance, and (2) the PSI from the WISC-IV.
Results
Reaction time
All participants were slower on the HLT versus the LLT, indicating that greater effort was required to complete this task. Patients' reaction times were slower than those of healthy children across both tasks (p values <0.01; Table 1). The error rate for pressing the button on trials with a red cross in the LLT was ∼10% for each group.
Reaction time data and analyses
Resting-state oscillations
Across the whole brain, no multivariate difference was evident between the groups in absolute power across bandwidths (Wilks lambda = 0.759, F(1,36) = 1.64, p = 0.17). There was a single univariate difference, however, with patients showing greater resting-state theta power compared with control subjects (F(1,36) = 5.78, p = 0.021). Regionally, however, patients had significantly lower total high-gamma power in bilateral central and parietal regions compared with healthy children (p < 0.05; Fig. 2). There were no significant differences between groups in measures of SD.

Deficit in regional gamma power in patients during the resting state. A, Compartmental organization of regional topoplot analysis is based on the work of Bosma et al. (2008). B, Children treated for brain tumors showed lower high-gamma power (60–100 Hz) in bilateral central and parietal brain regions.
Task-related changes in whole-brain activity
During the active period (≥0 ms from onset of the visual cue), there were main effects of changes in absolute global high-gamma power (60–100 Hz) for group (F(1,36) = 7.2, p = 0.011), task (F(1,36) = 10.79, p = 0.002), and time (F(19,18) = 5.98, p = 0.000), and for task × group interactions (F(1,36) = 7.48, p = 0.01), time × group interactions (F(19,18) = 9.35, p = 0.000), and task × time interactions (F(19,18) = 5.23, p = 0.000). All main effects and lower-order interactions were interpreted in the context of a three-way interaction among task × time × group (F(1,36) = 5.71, p = 0.000). Tests of simple effects for this interaction showed that the healthy children had a greater increase in absolute high-gamma power during task performance than children treated for brain tumors, that the increase was greater in the higher load task, and that the increase occurred in the early time epochs for both tasks (Table 2). Patients showed little change in absolute high-gamma power and no association with load (Fig. 3). There were no significant differences between groups in measures of SD. Analyses were also conducted for delta (0.5–3 Hz), theta (4–7 Hz), alpha (8–12 Hz), beta (13–29 Hz), and low gamma (30–59 Hz) bandwidths; however, there were no significant effects for any of these bandwidths.
Significant tests of simple effects for group differences in time epochs for the interaction of group × task × time in the whole-brain analyses of high-gamma (60–100 Hz) power

Across the whole brain healthy children showed significantly greater high-gamma power (60–100 Hz) in the LLT and HLT than patients. A, Topoplot map of high-gamma power used for these analyses. B, Time representation of whole-brain high-gamma activity across trials. The blue arrow depicts mean reaction time for healthy control subjects; the red arrow depicts the mean reaction time for patients. Highlighted regions represent epochs in which there were significant group differences in gamma power. See also Table 2.
Task-related whole-brain baseline measures
In the baseline period (−30 to 0 ms of visual cue onset), healthy children showed significantly more total whole-brain high-gamma power than patients for both the LLT (t(58) = 4.73, p < 0.0001) and HLT (t(58) = 3.65, p = 0.0006) paradigms. To visually depict changes in absolute high-gamma power within each group, we plotted the changes in total high-gamma power and measured the peak change in power from baseline for each group separately. Although patients had significantly lower total high-gamma power, they showed a greater relative potentiation of high-gamma across the whole brain in the LLT, but not the HLT (Fig. 4).
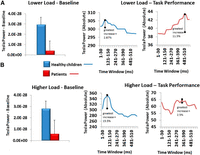
A, B, Baseline period whole-brain high-gamma levels and separate group total gamma responses for LLT (A) and HLT (B).
Task-related changes in regional activity
For the left central region, there was a main effect of time (F(9,28) = 5.3, p = 0.000) and time × group interactions (F(9,28) = 4.26, p = 0.002) and time interactions task interactions (F(9,28) = 2.6, p = 0.025), which were interpreted in the context of a three-way task × time × group interaction (F(9,28) = 3.13, p = 0.01). Tests of simple effects showed that the healthy children exhibited a greater increase in left central absolute high-gamma power during task performance than children treated for brain tumors, and that this difference was greater in the HLT, and in the early and middle stages of the trial (180–390 ms; Table 3, Fig. 5). Healthy children also displayed more absolute high-gamma power (60–100 Hz) than patients in the right occipital, left parietal, right parietal, and left frontal topographic regions for the HLT only (Table 4). There were no significant differences among groups in measures of SD.
Significant tests of simple effects for group differences in time epochs for the interaction of group × task × time in the regional analyses of left central region high-gamma (60–100 Hz) power

Healthy children showed significantly more fast-wave gamma power (60–100 Hz) reactivity in the left central region from the LLT to the HLT than patients. A, Topoplot map of high-gamma power used for these analyses. B, Time representation of whole-brain high-gamma power activity across trials. The blue arrow depicts the mean reaction time for healthy control subjects; the red arrow depicts the mean reaction time for patients. Highlighted regions represent epochs in which there were significant group differences in gamma power. See also Table 3.
Planned tests of simple effects for group differences in time epochs for high-gamma (60–100 Hz) power across all remaining brain regions
Task-related regional baseline measures
In the baseline period (−30 to 0 ms of visual cue onset), healthy children showed significantly more total left central high-gamma power than patients for both the LLT (t(58) = 3.015, p = 0.0038) and HLT (t(58) = 5.69, p < 0.0001) paradigms. To visually depict changes in the left central region in absolute high-gamma power within each group, we plotted the changes in total high-gamma power and measured the peak change in power from baseline for each group separately: although patients had significantly lower total high-gamma power, they showed a greater relative potentiation of high-gamma power in the left central region in the LLT, but not in the HLT (Fig. 6). Note that evidence of relative changes in gamma power from baseline in this lower cognitive load paradigm was published in our earlier study for the majority of our participants [previous parameters: 30–100 Hz; single time window across entire trial; and contralateral motor cortex (MIc) virtual sensor coordinate]. This earlier finding is similar to our topographic results of 60–100 Hz for this region.

Baseline period for left central region high-gamma levels and separate group total gamma responses for LLT (A) and HLT (B).
Neural generators of the high-gamma response
Based on source localization, left central gamma power (60–100 Hz) during both tasks was localized to the motor cortex (BA4), with healthy children showing markedly greater power than patients (Fig. 7A,B). As all participants were right handed, this region corresponded to their MIc. Right occipital source power was localized to the right primary visual cortex (BA18), and parietal source power to the bilateral regions of the primary somatosensory cortices (BA3). Other prominent HLT source powers were localized in the anterior cingulate cortex (ACC; BA24) and the posterior cingulate cortex (PCC; BA23, A29, and A30), respectively (Fig. 5C–F). Overall, patients displayed lower high-gamma power in these regions.

Left central region gamma reactivity was localized to the left precentral gyrus, BA 4, and MIc. A, Healthy children showed markedly more MIc high-gamma power than patients in both tasks. The corresponding time course and power values are shown in B. C–F, Regional group differences in high-gamma power localized to the right primary visual cortex, BA 18 (C); bilateral somatosensory cortices, BA3 (D); right ACC, BA 24 (E); and left PCC, BA 23, 29, and 30 (F). Time windows shown were the windows in which group-averaged activity was most robust. See also Table 4.
Correlations between gamma power and cognitive performance
Finally, we examined whether high-gamma power predicted cognitive performance. There were no significant relations between MEG reaction times and total high-gamma power during resting state in either group. However, patients showed a significant correlation between less of an increase in high-gamma power (left central region) and slower reaction times at several time windows during LLT performance (151–180 ms: r = −0.71, p = 0.0005; 181–210 ms: r = −0.71, p = 0.0005; 211–240 ms: r = −0.71, p = 0.0005; 301–330 ms: r = −0.69, p = 0.0008; 361–390 ms: r = −0.68, p = 0.001; 391–420 ms: r = −0.68, p = 0.001; 421–450 ms: r = −0.68, p = 0.001). In healthy children, greater increases in whole-brain high-gamma power (60–100 Hz) immediately after the visual cue predicted faster reaction times in the HLT (31–60 ms: r = −0.7, p = 0.0012). There was no relationship between high-gamma power increases and reaction time in patients on the HLT; however, smaller increases in high-gamma power on the HLT predicted slower processing speeds on the WISC-IV (181–210 ms: r = 0.67, p = 0.0012; 211–239 ms: r = 0.62, p = 0.0035; 240–270 ms: r = 0.70, p = 0.0006), suggesting that gamma characteristics in the MEG task could predict broader cognitive impairment outside the MEG in patients.
Discussion
We present novel evidence that high-gamma oscillations (60–100 Hz) are disrupted in children treated with CRT for brain tumors of the posterior fossa. Overall, these children had lower total high-gamma power and lower total increases in high-gamma power during task performance, regardless of cognitive load. Reduced levels of total high-gamma power were correlated with poorer task performance in these children. In contrast, healthy children demonstrated higher total high-gamma power, and significant total increases in response to task requirements and increased cognitive load. Moreover, these increases in high-gamma power were correlated with faster response times during task performance in healthy children. Lower levels of total high-gamma power (60–100 Hz) at rest and during task performance may be an index of impaired information processing in the developing brain. As a lack of gamma power was observed consistently across resting, task-baseline, and task-active states, and varying stages of cognitive demand, we also suggest that characteristics of neural oscillations that persist between resting state and task operations may be an ideal biomarker for populations whose deficits become apparent during cognitive performance.
The relationship of increases in total high-gamma power to task performance and increased cognitive load may reflect increased synchrony of fast oscillations recruited to support functions underlying task performance, such as perceptual processing [60–250 Hz (Edwards et al., 2005); 40–200 Hz (Lachaux et al., 2007)], attention [≥60 Hz (Hauck et al., 2007; Ray et al., 2008)], and volitional movement [65–80 Hz (Cheyne et al., 2008); 62–87 Hz (Waldert et al., 2008); 75–100 Hz (Crone et al., 1998)]. The observation that further gamma potentiation did not occur in patients during the higher load task, relative to the lower load task, suggests that high-gamma power had reached an asymptote and further potentiation in response to a more difficult task was not possible. We recently published findings that children treated for brain tumors with CRT qualitatively showed relatively greater increases from baseline in visual and motor gamma power (30–100 Hz) during a lower load visual-motor reaction time task (Dockstader et al., 2013). The current findings add important insight into these earlier findings. We propose that children treated with CRT have reduced total high-gamma power (60–100 Hz) and that global or regional relative increases compared with healthy control children during task performance may reflect compensatory mechanisms for total gamma loss in the lower load task (Fig. 8). Compensatory increases in gamma activity during task performance have been documented in other clinical populations with suggested gamma deficits (Buard et al., 2013; Florin et al., 2013). As gamma synchrony is thought to reflect neural computations underlying numerous higher-order processes (Fries, 2009), reduced synchrony power of these fastest oscillations suggests that computational processes may be compromised in patients, which leads to impaired task performance. The lack of total high-gamma power in our patients may reflect the limited capacity of their brains to fire in synchrony at the fastest oscillations.

Hypothesized high-gamma power (60–100 Hz) neural response to cognitive demand in healthy children and children treated for brain tumors with CRT. We propose that children treated with CRT have reduced total high-gamma power (60–100 Hz) and that relative high-gamma increases compared with healthy control children in the lower load task may reflect compensatory mechanisms for lower levels of absolute gamma power. The observation that further gamma potentiation did not occur in patients during the higher load task, relative to the lower load task, suggests that high-gamma power has an asymptote in this population, which makes further potentiation in response to a more difficult task impossible. The lack of total high-gamma power in our patients may reflect the limited capacity of their brains to fire in synchrony at the fastest oscillations.
Gamma deficits in patients were specific to the high-gamma band (60–100 Hz). While gamma oscillations are often portrayed with a broadly defined frequency range of 30–100 Hz, we did not show any group differences in gamma-band modulations from 30 to 59 Hz. The fact that high-gamma deficits correlated with poor processing speeds in our patients suggests that oscillations of >60 Hz play a critical role in our task. Other studies have demonstrated that event-related activations of >60 Hz are reliably associated with processing speeds (Brücke et al., 2013), attentional modulation (Hauck et al., 2007; Ray et al., 2008), and decision making (Guggisberg et al., 2007). Moreover, very circumscribed deficits in high-gamma power have been reported in other clinical populations with cognitive impairments (Sun et al., 2012, 2013; Snijders et al., 2013). Future work might reveal that specific cognitive effects are best characterized within well defined gamma sub-bands.
Both global and regional total high-gamma power differences were shown between our groups. Global increases in oscillatory power can reflect increases in long-range connectivity when multiple cortical regions are involved in task performance and localized increases in communication in task-specific cortical regions (Fries et al., 2001; Fries, 2005). Since cognitive functions are thought to depend on integrated activity across specialized brain regions, either global changes or regional changes in oscillatory activities may influence the performance of cognitive tasks in a population where tumor location is specific but treatment effects (such as chemotherapy and whole-brain CRT) are diffuse across the entire brain. In our study, the relationship of increases in gamma power to increases in processing speed was particularly associated with the MIc on our visual-motor tasks. Gamma power increases in MIc that occurred just before, and during, the motor response may reflect the activity of cortico-subcortical networks involved in feedback control for motor performance (Cheyne et al., 2008). With increased cognitive load, increases in gamma power were potentiated in the healthy children, which may also enhance regional communication relevant for efficient task performance when cognitive demand is increased (Fries et al., 2001; Fries, 2005).
The more demanding task also elicited increased gamma responses from several other neural generators, including the bilateral somatosensory cortices and the dorsal ACC and PCC. The dorsal part of the ACC is connected with the prefrontal cortex and parietal cortex, as well as the motor system and the frontal eye fields, making it a central station for processing top-down and bottom-up stimuli and assigning appropriate control to other areas in the brain. The ACC seems to be especially involved when effort is needed to carry out a task (Botvinick et al., 1999; Bush et al., 1999; Carter et al., 1999). Although there is less certainty about the function of the posterior cingulate cortex, PCC subregions showed distinct patterns of activity modulation during the performance of an attentionally demanding task (Leech and Sharp, 2014). Although our patients showed peaks in each of these regions, they showed lower total gamma power in these regions than the healthy control children. These observations suggest an overall lack of gamma rhythmicity in many neural regions in children treated for brain tumors with cranial radiation. They also suggest that task performance in this population may be compromised by task-specific regional requirements of increased gamma power during activities. The fact that the beamformer analysis did not find localized peaks in the left frontal region, which showed significant regional differences in the topographical analysis, suggests that there is not a single neural generator of gamma activity in this area during task performance. More likely, multiple gamma sources are activated in frontal regions during task performance, suggesting that future directions should include a network analysis asking whether multiple frontal gamma sources act in tandem during such a task.
The current findings suggest that patients show a reduced fast-oscillation response after treatment for brain tumors. Although factors such as tumor pathology, radiation dose, and amount of resection may all contribute differentially to high oscillation synchrony, we did not have a large enough sample to consider these variables and our patient population. Moreover, our patient sample is heterogeneous in terms of tumor type and radiation dose. However, when tumor variables are controlled for, CRT is more associated with declines in processing speed, IQ, and working memory performance than surgery-only or surgery and chemotherapy treatment in pediatric posterior fossa tumor populations (Anderson et al., 1997; Schatz et al., 2000b; Langer et al., 2002). Brain-based explanations for CRT-related behavioral delays in information-processing speed include radiation-induced mechanical disruptions in relaying neural signals such as injury to existing white matter that modulates conduction times and synchrony of impulse conduction (Fields, 2008a,b) or damage to glial progenitor cells that regulate future myelination and neurotransmitter functions that are important for neural transmission (Monje et al., 2002; Dietrich and Kempermann, 2006; Roy et al., 2007). Future directions for study should include investigating whether compromised white matter structure is related to abnormal neuronal activation after CRT and whether treatment with surgery alone, or surgery and chemotherapy without CRT, and other patient variables predict gamma deficits.
In summary, we present novel and compelling evidence that the power of high-gamma oscillations (60–100 Hz) may directly index how quickly the brain can process information. Understanding how neural injury transgresses into cognitive impairment is critical to the development of appropriate intervention and rehabilitation strategies. We submit that the amount of total high-gamma power is a robust reflection of normal and impaired information processing.
Footnotes
- Received December 13, 2013.
- Revision received May 12, 2014.
- Accepted May 18, 2014.
-
This research was supported by operating grants from by the Canadian Institutes of Health Research, the Pediatric Oncology Group of Ontario, and the Garron Family Cancer Centre at the Hospital for Sick Children. We thank Dr. Doug Cheyne for providing Brainwave software, and Dr. Suresh Muthukumaraswamy for providing the visual stimulus. We also thank Marc Lalancette for developing our head motion analysis software. In addition, we thank Drs. Michael Salter and Sam Doesburg for reviewing earlier versions of the manuscript.
-
The authors declare no competing financial interests.
- Correspondence should be addressed to Dr. Colleen Dockstader, Paediatric Brain Tumour Program, Division of Haematology/Oncology, and Department of Psychology, The Hospital for Sick Children, 686 Bay Street, 8th floor, Toronto, ON M5G 0A4, Canada. colleen.dockstader{at}sickkids.ca
- Copyright © 2014 the authors 0270-6474/14/348813-12$15.00/0




