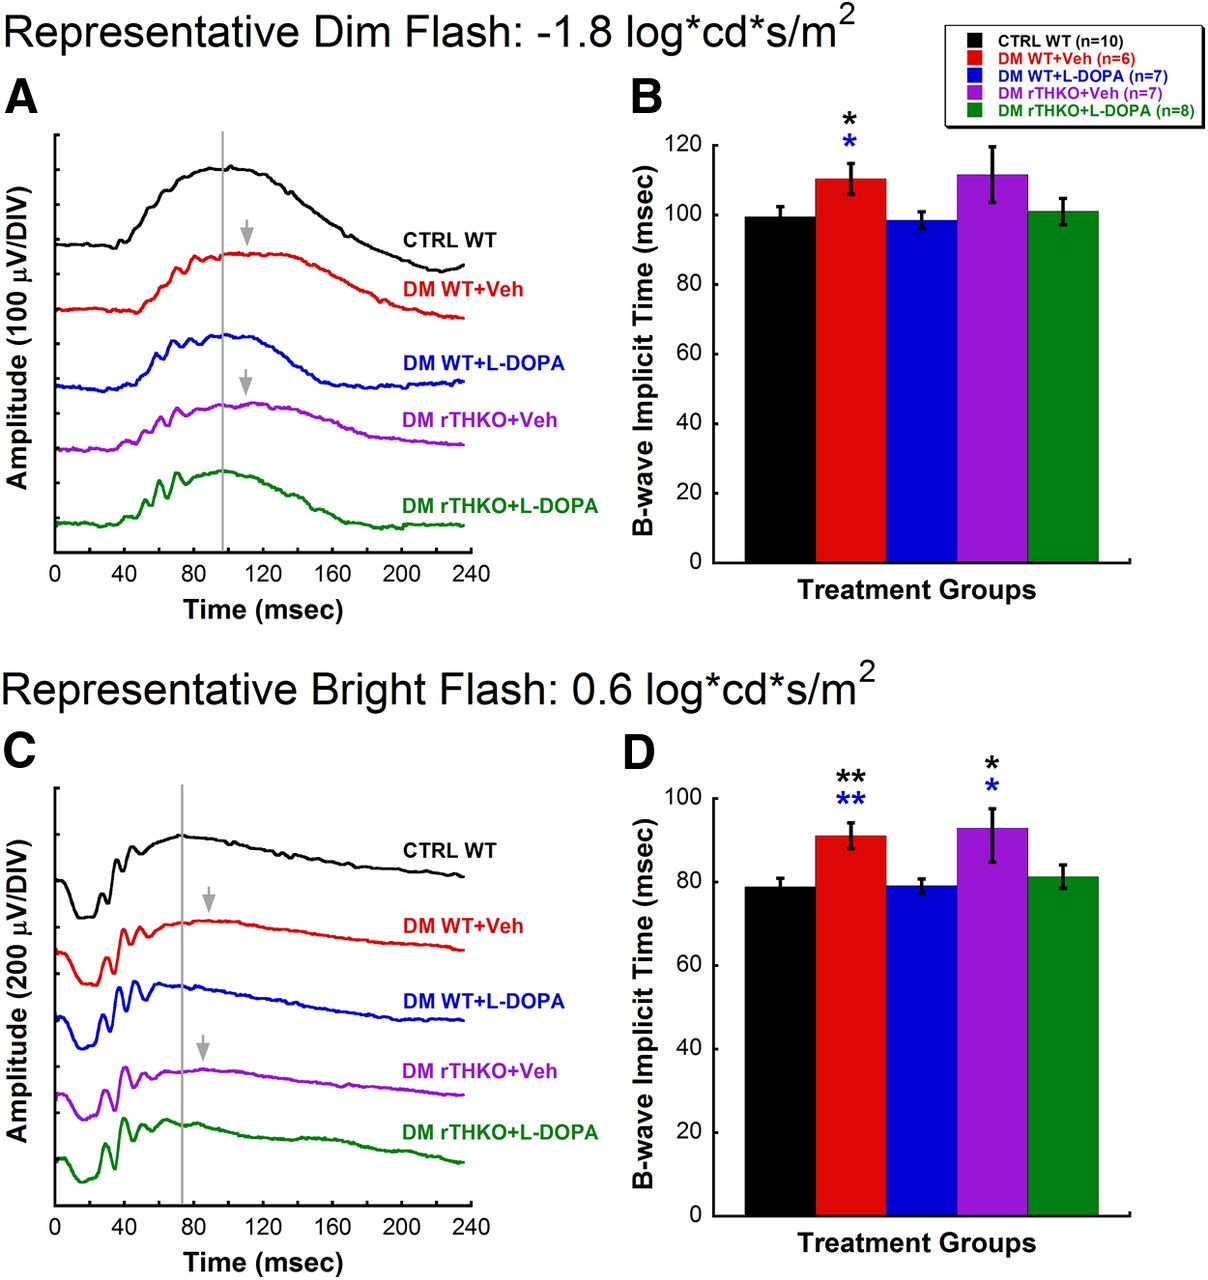
Changes in DA levels due to diabetes affect dark-adapted retinal function. A, B, Representative raw waveforms and average b-wave implicit times in response to a dim-flash stimulus (−1.8 log cd s/m2) at the 5-week time point. C, D, Representative raw waveforms and average b-wave implicit times in response to a bright-flash stimulus (0.6 log cd s/m2) at the 5-week time point. The following colors represent each treatment group: black, CTRL WT; red, DM WT + Veh; blue, DM WT + l-DOPA; purple, DM rTHKO + Veh; and green, DM rTHKO + l-DOPA. The gray lines indicate the peak of the b-wave in a CTRL WT mouse; gray arrows indicate the peak of the response when delayed. DM WT + Veh mice exhibited significantly delayed b-wave responses elicited with both dim (post hoc comparison, p < 0.05) and bright (post hoc comparison, p < 0.01) flash stimuli compared with CTRL WT and DM WT + l-DOPA mice. l-DOPA treatment was able to restore ERG responses of DM WT mice (DM WT + l-DOPA) to those of CTRL WT mice. Similarly, DM rTHKO + Veh mice had severely delayed responses from CTRL WT and DM WT + l-DOPA animals at the bright flash stimulus (post hoc comparison, p < 0.05). The color of the asterisk indicates the treatment group in which significance was reached.


