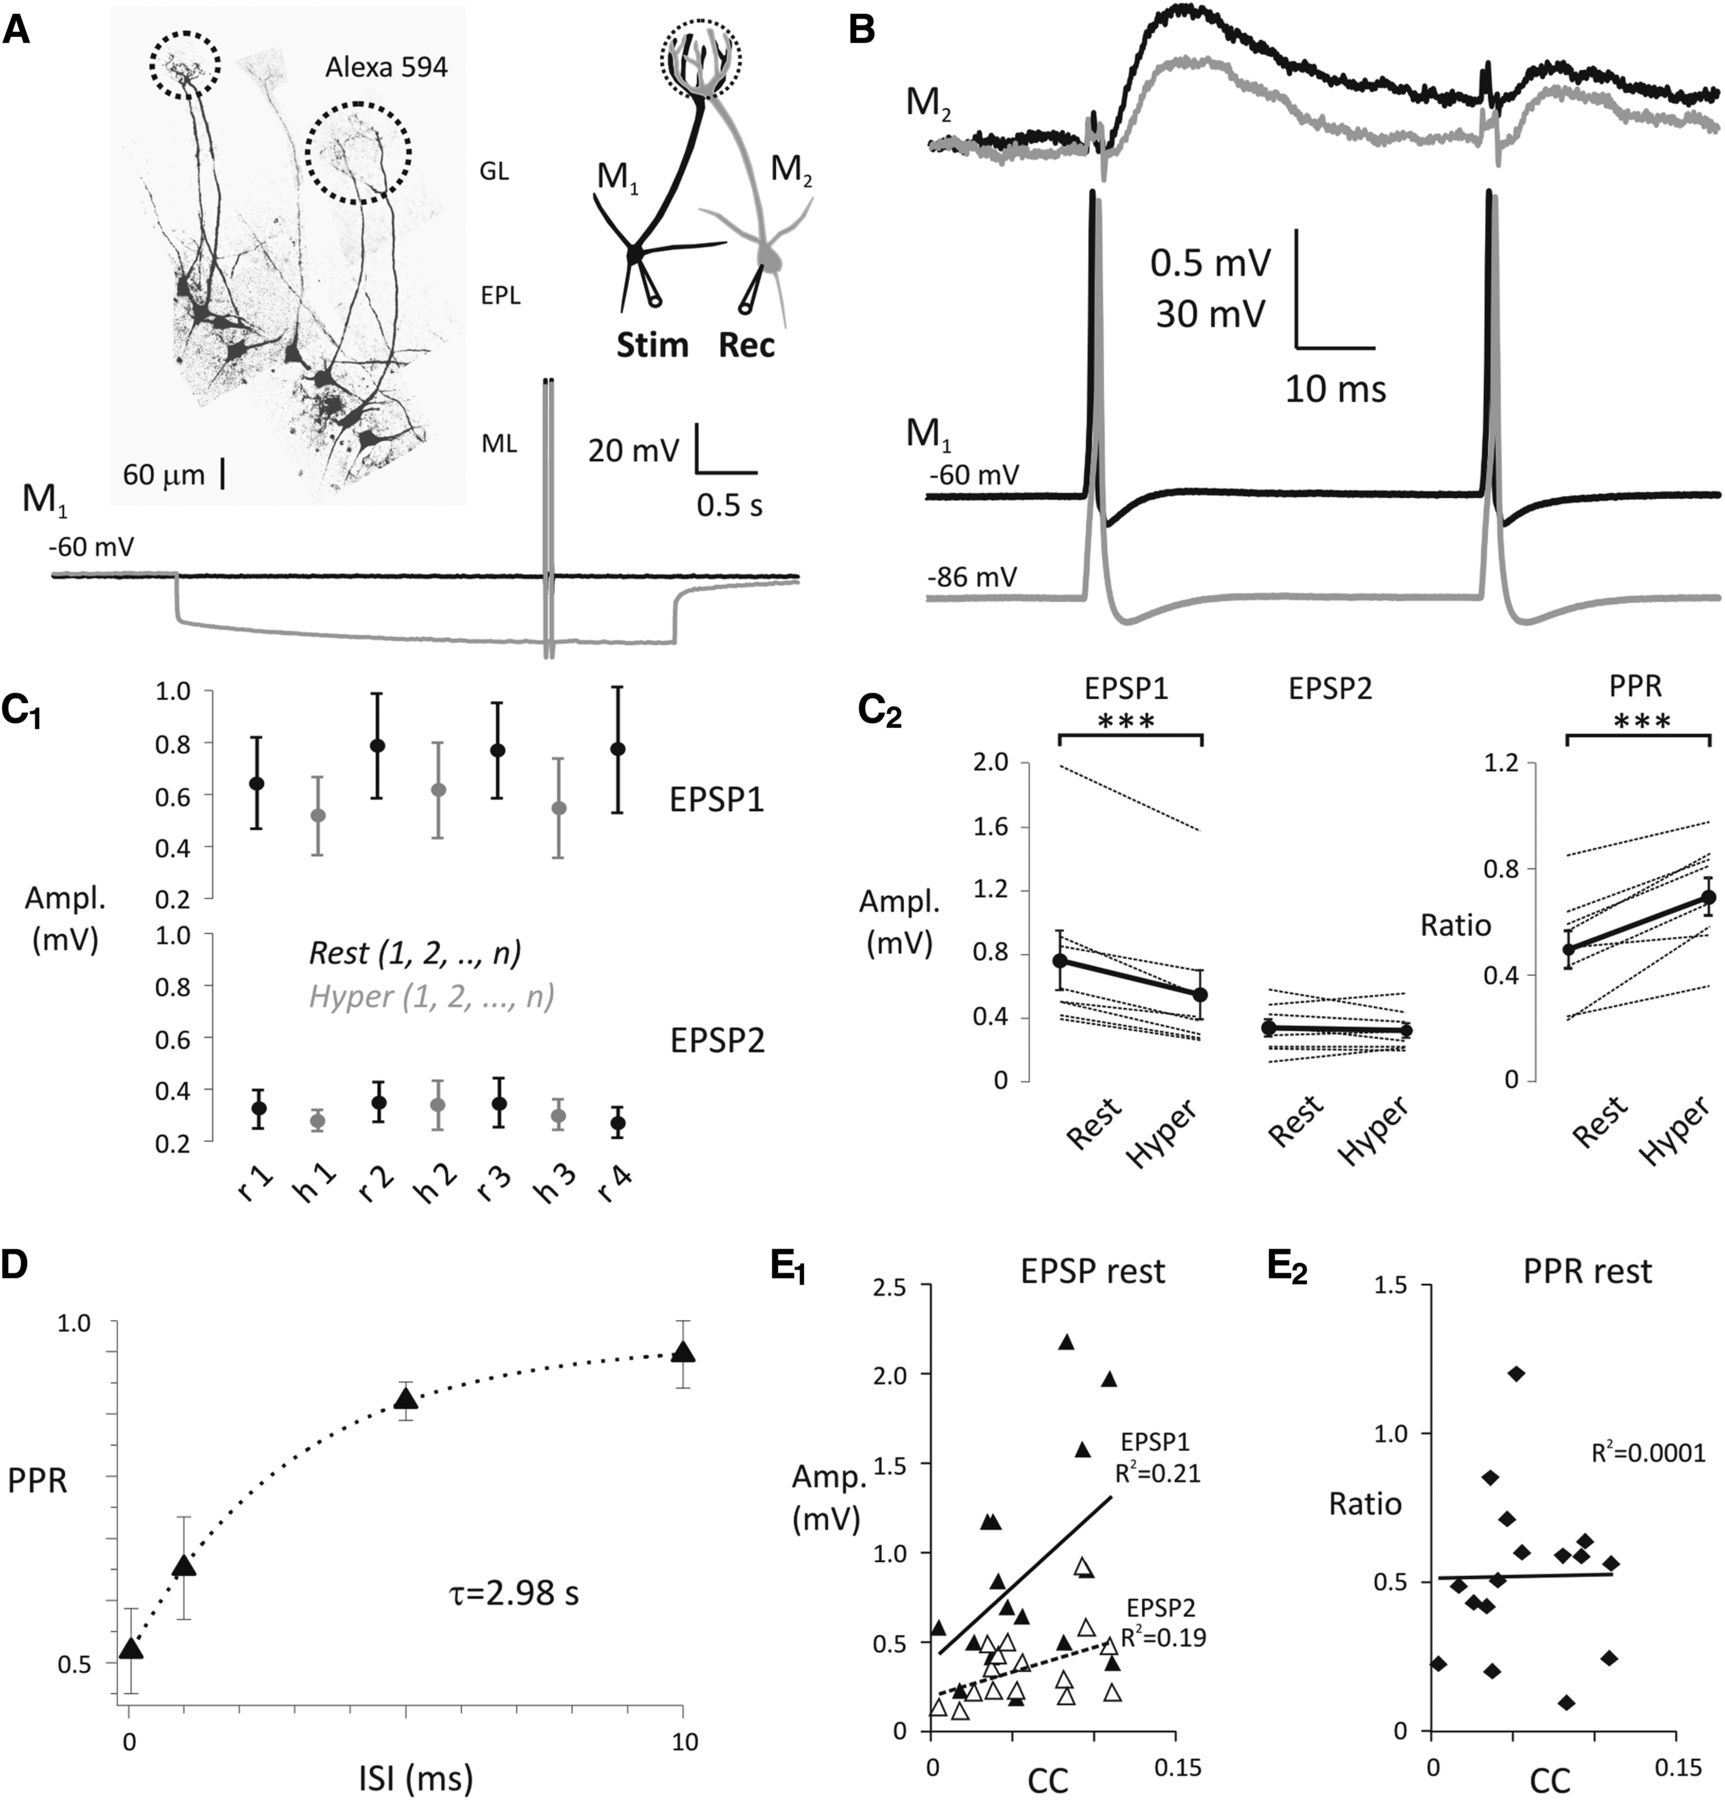
Hyperpolarization of the presynaptic olfactory mitral cells decreases the strength of mitral–mitral cell connections. A, Pairs of olfactory mitral cells (M1, presynaptic; M2, postsynaptic) projecting to the same glomerulus were found by electroporation with Alexa-594. Dashed circles in glomerular layer indicate glomeruli and projecting pairs of mitral cells. ML, Mitral cell layer; EPL, external plexiform layer; GL, glomerular layer. See the schematic representation of experimental design on the right. Pairs of somatic APs (20 Hz) were evoked by current injection (1.8–2.4 nA, 2 ms) in M1 either at Vrest (black) or Vhyper (gray). B, Representative experiment shows a pair of APs in M1 delivered either at Vrest (black) or Vhyper (gray) and the average of evoked EPSPs in M2 recorded at Vrest. Colors sign corresponding recordings in M1 and M2. C1, EPSPs were recorded in cohorts of five sweeps by alternating presynaptic membrane potential between Vrest (black) and Vhyper (gray). C2, EPSP amplitudes (left) and PPRs (right) are shown at presynaptic Vrest (rest) and Vhyper (hyper). Black circles connected with thick black lines represent the mean of eight individual experiments. ***p < 0.001. D, Recovery of the mitral–mitral synapse from depression was fitted with a single exponential (inter-stimulus interval [ISI]). E1, The amplitude of EPSP1 (filled triangles) and EPSP2 (open triangles) plotted as a function of coupling coefficient (CC). E2, PPRrest evoked at Vrest plotted as a function of coupling coefficient.


