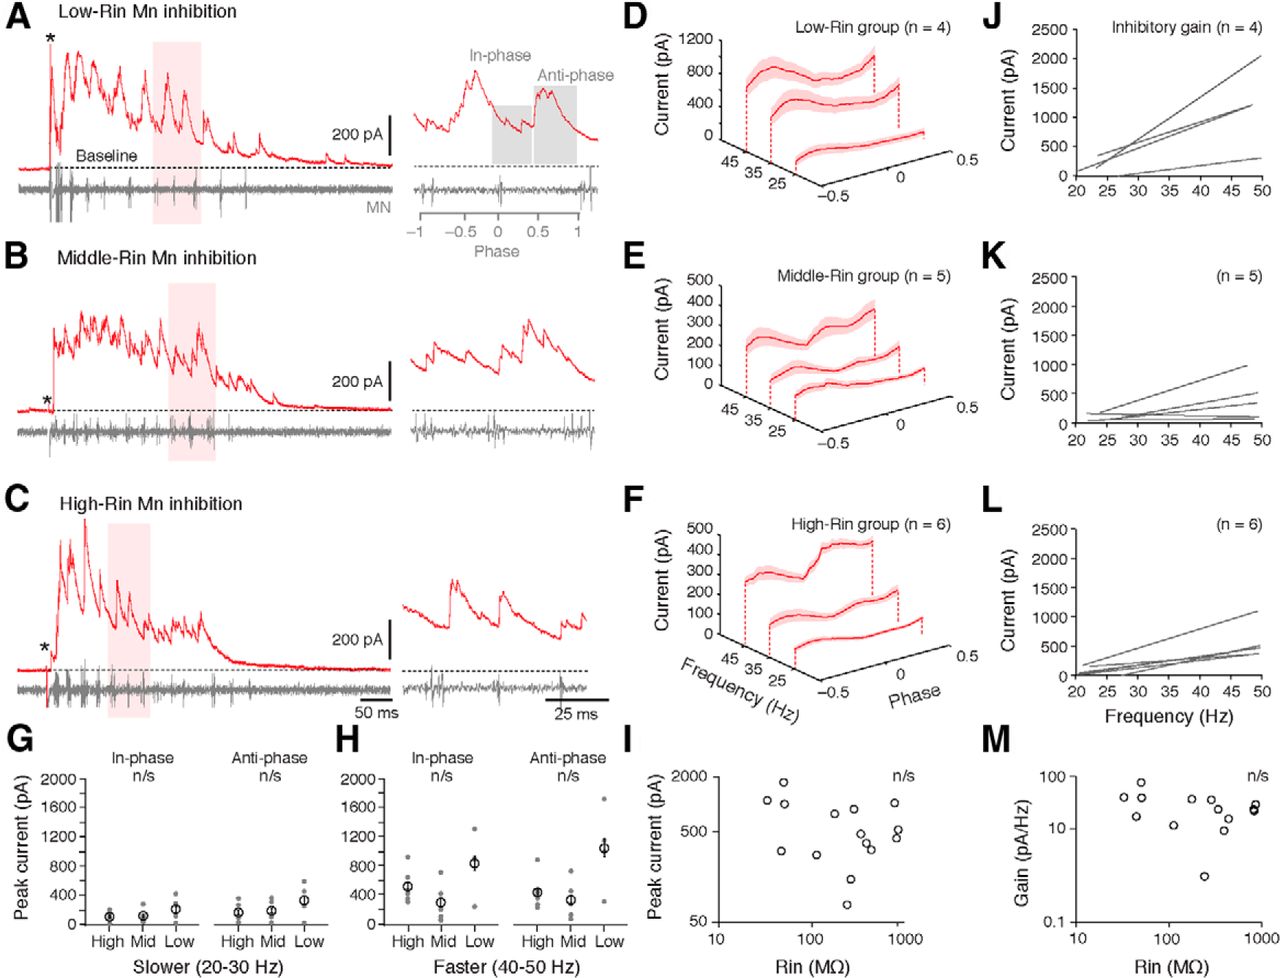
Changes in inhibitory drive to motoneurons (Mns) as a function of speed and input resistance. A–C, Voltage-clamp recordings of inhibitory currents during a bout of fictive swimming (stimulus artifact at asterisk) from Mns with progressively higher input resistance (Rin). Expanded traces on the right are taken from regions shaded in red. A, Right, the regions assessed for in-phase and anti-phase inhibition are shaded in gray. D–F, Inhibitory currents normalized to phase and averaged in 10 Hz speed bins for low- (D), middle- (E), and high-Rin pools of motoneurons (F). G, Comparison of inhibition arriving in-phase or anti-phase between the different motor pools at 20–30 Hz (slower swimming). H, As in G, but at 40–50 Hz (faster swimming). I, Log-log plot of peak inhibitory current as a function of Mn Rin. Each data point represents an individual preparation. J–L, Regression lines of inhibitory current as a function of speed (gain) for Mns within the groups shown to the left in D–F. Note, for low-Rin motoneurons, we were only able to obtain IPSC data from 4 of the 12 cells. M, Log-log plot of inhibitory gain as a function of Mn Rin. Each data point represents an individual preparation.


