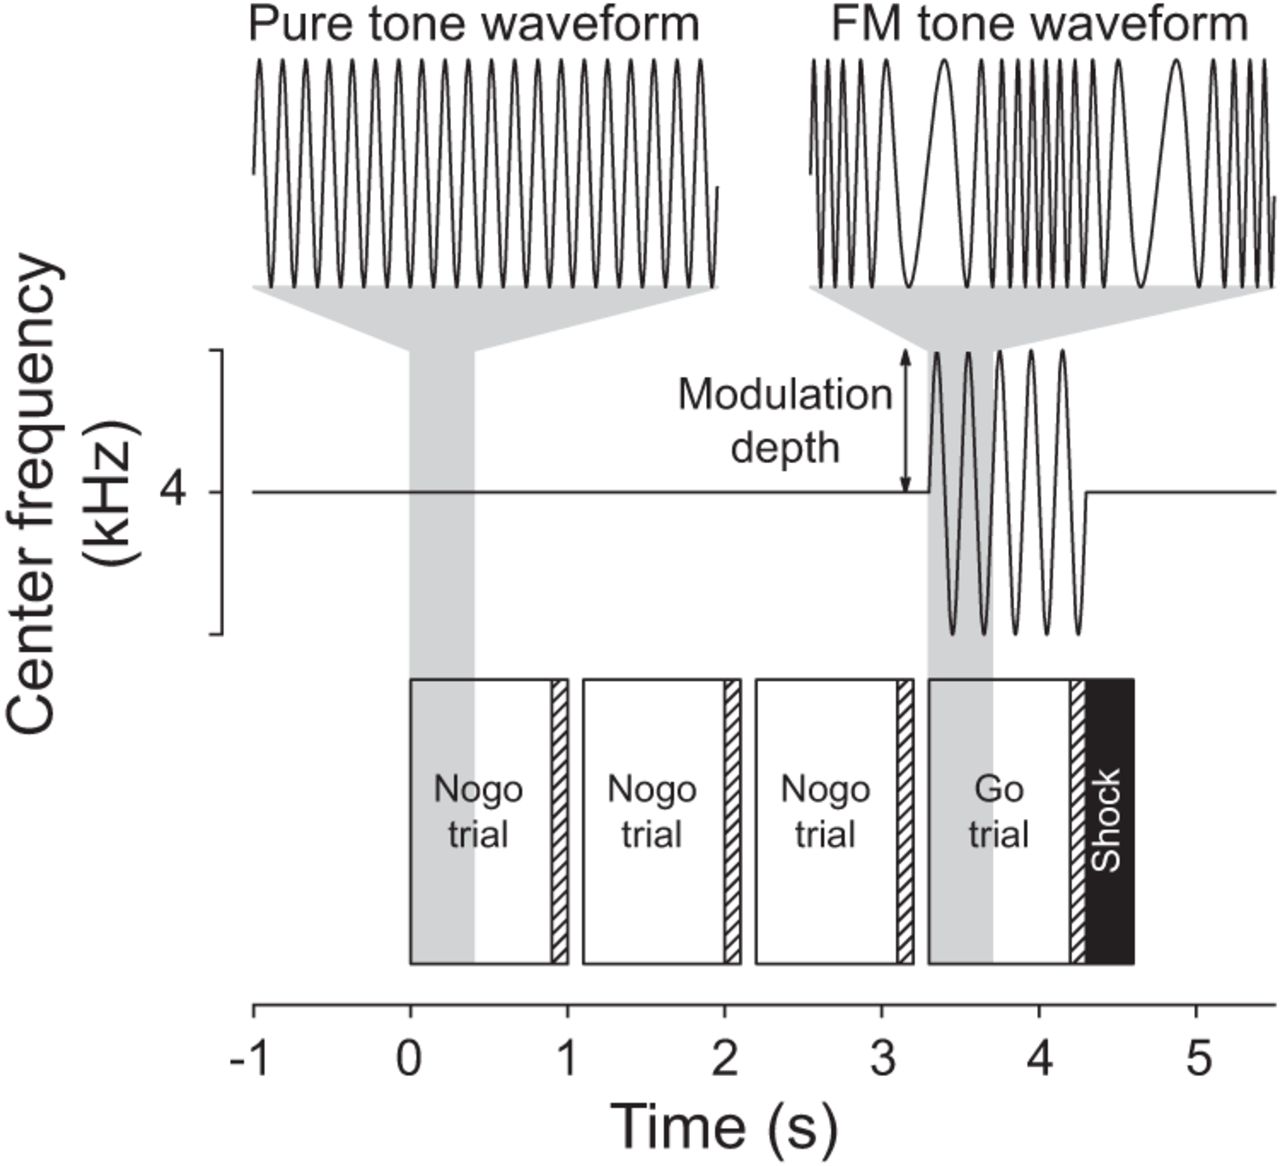
Overview of FM detection task. The target (a sinusoidally frequency modulated tone) is embedded in a continuous 4 kHz carrier at a rate of 5 Hz. Task difficulty was modulated by adjusting the maximum frequency deviation from 4 kHz (arrow, modulation depth). Examples of the fine structure for a pure and FM tone waveform are shown above the center frequency plot. Trials, each lasting 1 s, were presented at a rate of ∼1/s while the animal was drinking from the water spout. Three to five no go trials were delivered between each go trial. Trials were suspended when animals broke contact with the spout for >50 ms. To determine whether the animal detected the target, spout contact was monitored during the last 100 ms of each trial (cross-hatched region) and scored as a “yes” response if they were off the spout for at least 50 ms. A 300 ms aversive stimulus followed each go trial (black). Middle and bottom images are shown on the same timescale; the temporal relationship of the fine structure examples in the top image are indicated by the gray background.


