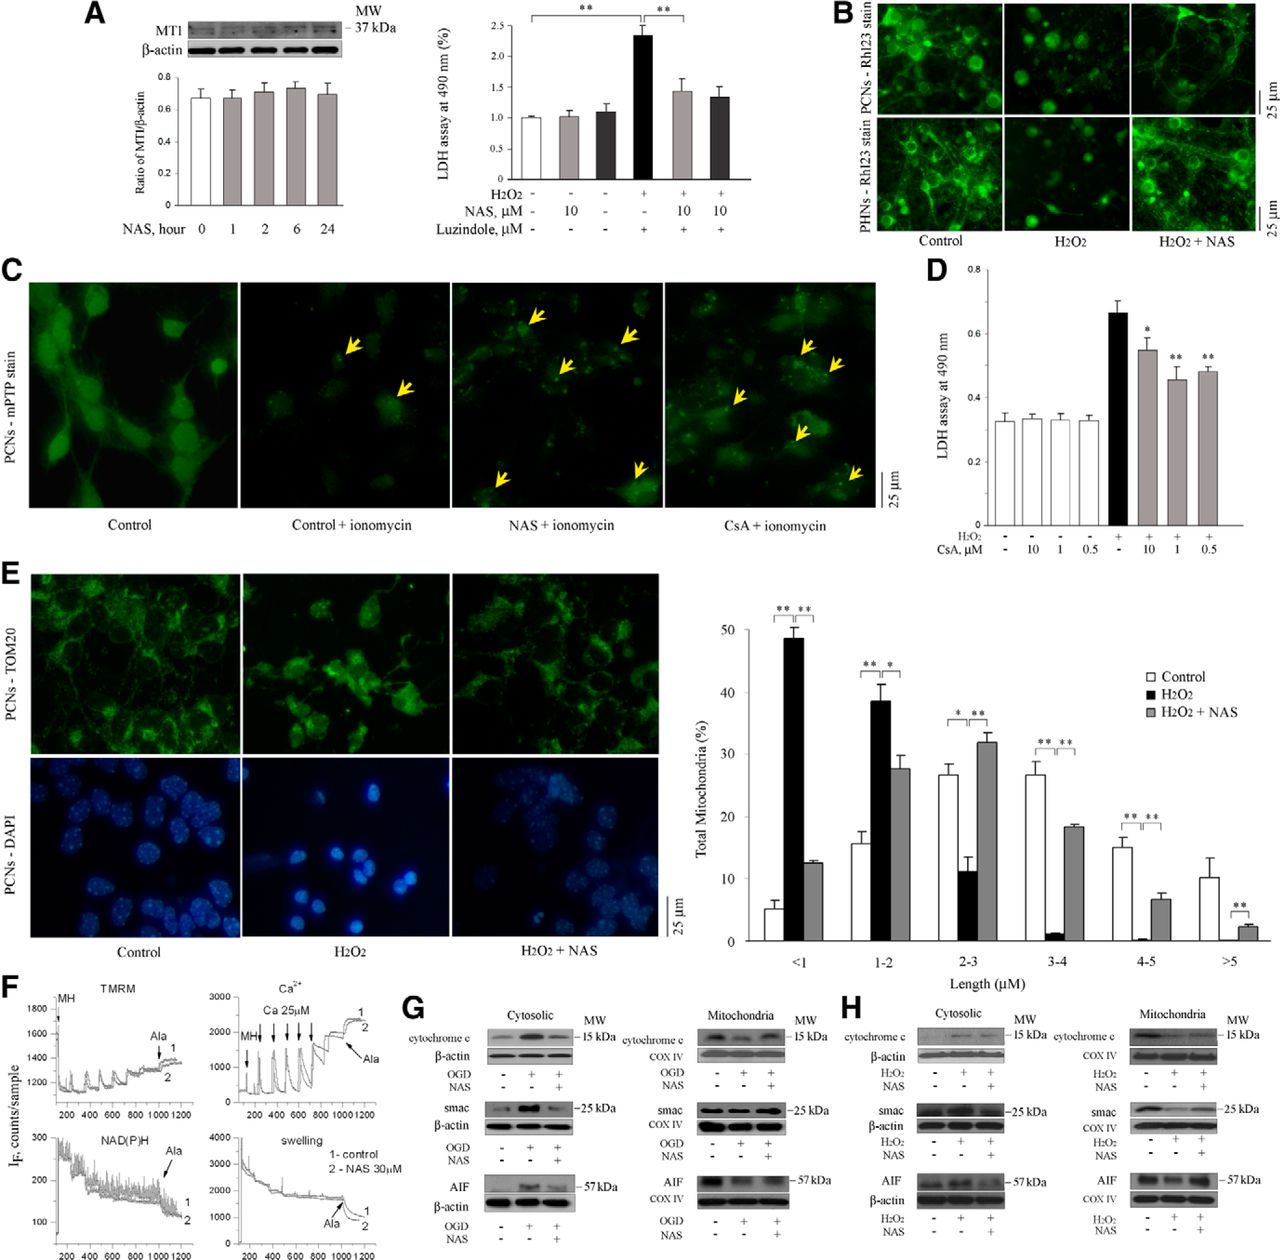
NAS does not activate MT1 but slows the dissipation of ΔΨm, influences the opening of mPTP, and reduces the release of mitochondrial apoptogenic factors during H2O2- and/or OGD-induced cell death. PCNs were treated with NAS for 0, 1, 2, 6, and 24 h. Whole cells were extracted and analyzed by Western blotting using antibody to MT1. β-Actin was used as loading control. This blot is representative of three independent experiments. Densitometry was performed to quantify the intensity of the bands from the three independent experiments (A, left). PCNs (A, right; B, top) and PHNs (B, bottom) were subjected to 1000 μmol/L H2O2 for 18 h with or without NAS (10 μmol/L; B) or luzindole (A, right). The supernatants were collected for LDH assay (A, right); **p < 0.01. The living cells were then stained with 2 μmol/L Rh 123 to determine the electrostatic charge of the mitochondria (B). PCNs were submitted for Image It Live mPTP assay (C). PCNs were coincubated with 10 μmol/L NAS or CsA and loaded with calcein AM and CoCl2 for 15 min, and 1 μmol/L ionomycin was then added. Tests of mPTP activation were conducted and digital images were taken (C). Cell death was induced in PCNs by 18 h exposure to 1000 μmol/L H2O2 with or without indicated concentrations of CsA and evaluated by LDH assay (D). Statistically significant differences (n = 6) are indicated with *p < 0.05 and **p < 0.01. The representative images of mitochondria stained for TOM20 (E, top) and matched DAPI images for nuclei (E, bottom) were shown and the quantitation of mitochondrial fragmentation was measured (E, right). The data represent the three independent experiments. *p < 0.05 and **p < 0.01. Brain mitochondria (0.25 mg/ml) energized with glutamate/malate 5 mmol/l were challenged with a series of Ca2+ additions (25 μm each) until they began to spontaneously release Ca2+ (F). Changes in ΔΨm (F, left) and absorbance (F, rightl), as indicators of mitochondrial swelling and induction of mPT, were monitored simultaneously. Pore-forming agent Alameticin (Ala) was added in the end of each sample. NAS (30 μm) was added 1 min before Ca2+ addition. Cell death was induced by subjecting PCNs to OGD for 3 h (G) or 1000 μmol/L H2O2 for 18 h (H) with or without 10 μmol/L NAS (G, H). Subsequently, cells were extracted, and either cytosolic components (G, H, left) or mitochondrial lysates (G, H, right) were obtained and analyzed by Western blotting using antibodies to cyto. c, Smac, and AIF. β-Actin and COX IV were used as cytosolic and mitochondrial component loading controls, respectively. This blot is representative of three independent experiments. Scale bars, 5 μm.


