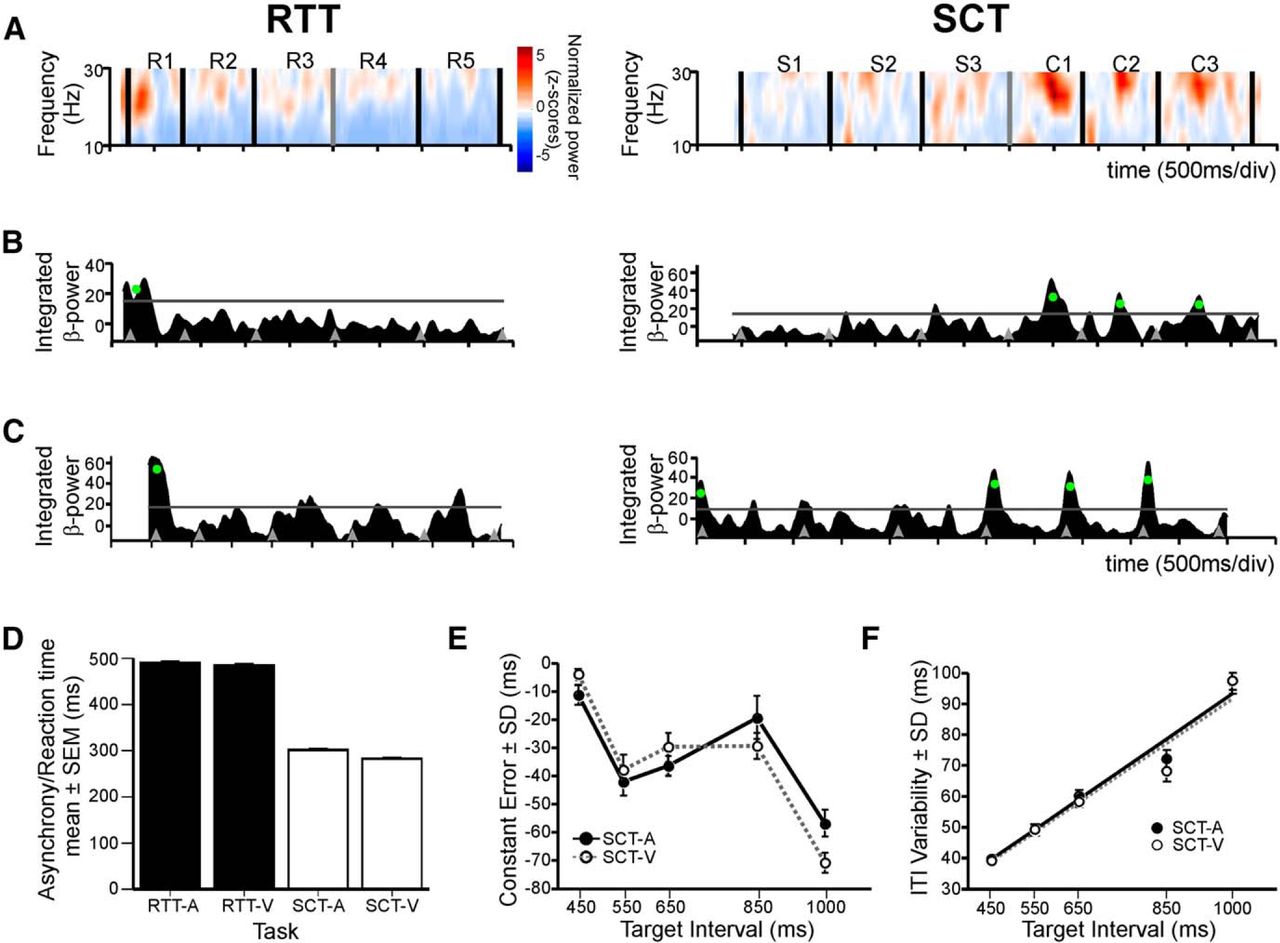
A, Normalized spectrogram of an example LFP recording tuned to serial order during irregular tapping (RTT) and isochronous tapping (SCT). In each plot, the time during task execution and spectral frequency components are represented in the horizontal and vertical axes, respectively. Black bars indicate the time of button taps, and on top of each plot the label of the respective serial-order element is shown. For the SCT, the interstimuli target interval was 1000 ms. S1–S3 correspond to the sensory-guided phase of the task, whereas C1–C3 correspond to internally driven tapping. The normalized spectral power is color coded as indicated by the color bar. B, Integrated β-power curves of the same LFP shown in A. Gray horizontal lines show the threshold (mean + 1 SD), and green dots mark valid modulations. Gray arrowheads mark the tap times. C, Power curves of a different LFP recording site. For the SCT, the interstimuli target interval was 1000 ms (same conventions as for B). D, Mean reaction times and asynchronies for the RTT and SCT are as follows: RTT [mean (SD)], audio (A), 489.6 (6.9); visual (V), 484.1 (5.6); SCT, A, 301.1 (13.8); V, 282.2 (13.7). E, Constant error (mean ITI minus the target interval) of the monkeys' produced intervals. F, Variability (SD) of the ITI as a function of target interval during the SCT. Solid and dotted lines are linear regressions of the data from the auditory (R2 = 0.97, p = 0.002) and visual (R2 = 0.94, p = 0.006) conditions, respectively.


