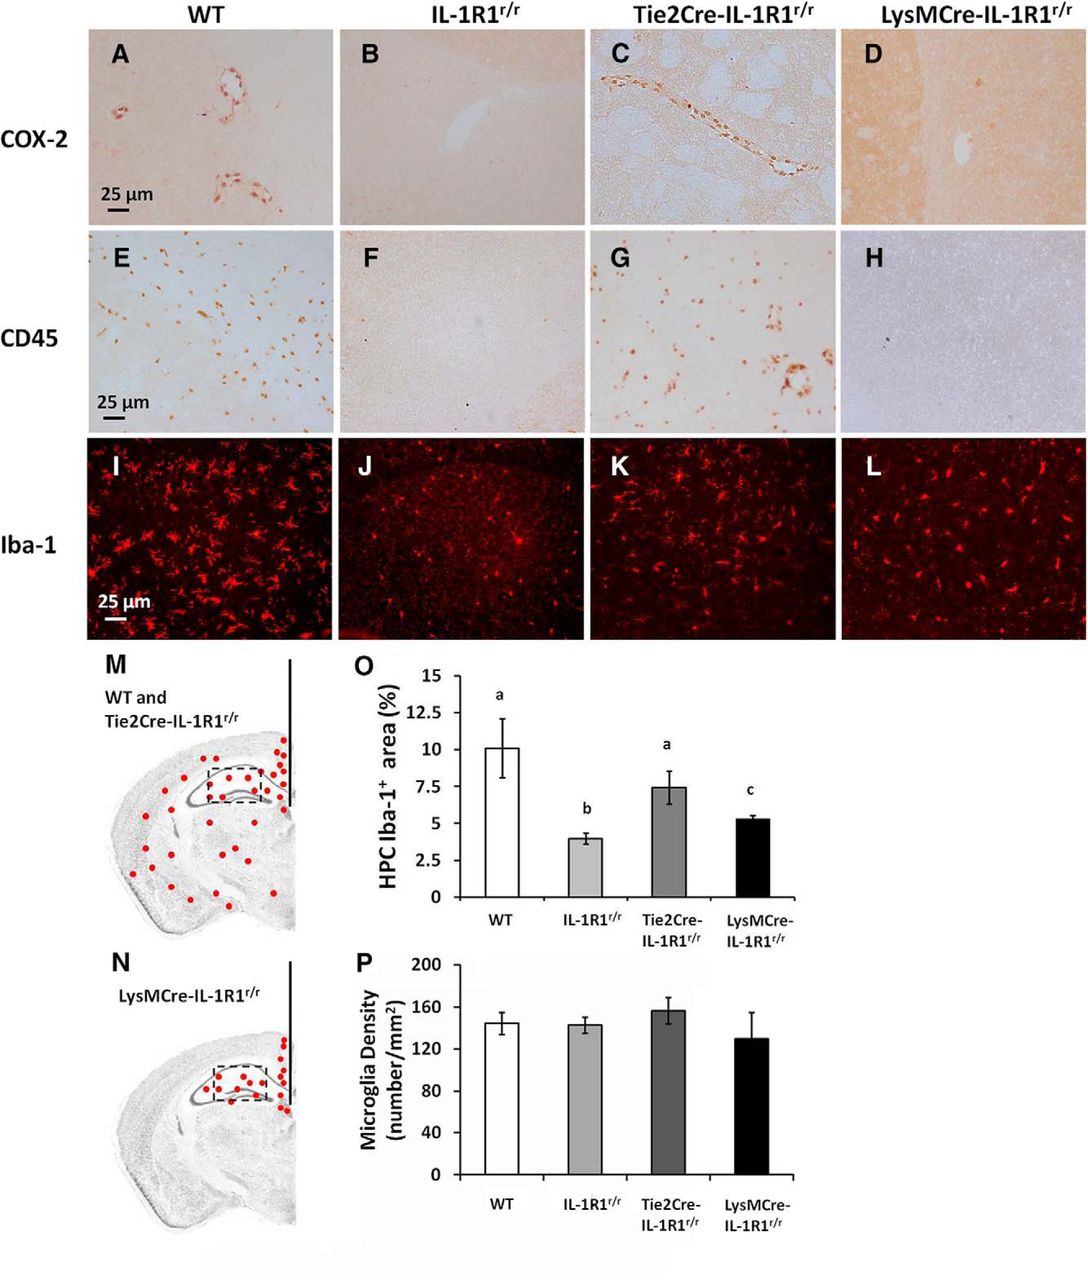
IHC labeling of COX-2, CD45, and Iba-1 following an intracerebroventricular injection of IL-1β. Brain sections from a wild-type animal, IL-1R1r/r animal, Tie2Cre-IL-1R1r/r animal, and LysMCre-IL-1R1r/r animal after an intracerebroventricular injection of IL-1β were labeled with COX-2 (A–D), CD45 (E–H), and Iba-1 (I–L). Representative distribution pattern of Iba-1 labeled cells in a wild-type or Tie2Cre-IL-1R1r/r animal (M) and a LysMCre-IL-1R1r/r animal (N). Red indicates Iba-1-labeled cells. Coronal sections of mouse brains were taken at 1.70 mm posterior to bregma. Scale bar, 25 μm. O, Quantification of fluorescence intensity in the hippocampal area (square box). Bars represent group means ± SEM. Differing letters (i.e., a, b, or c) represent significant difference between groups (p ≤ 0.05). HPC, Hippocampus. P, Quantification of microglia numbers in the hippocampal area. Bars represent group means ± SEM.


