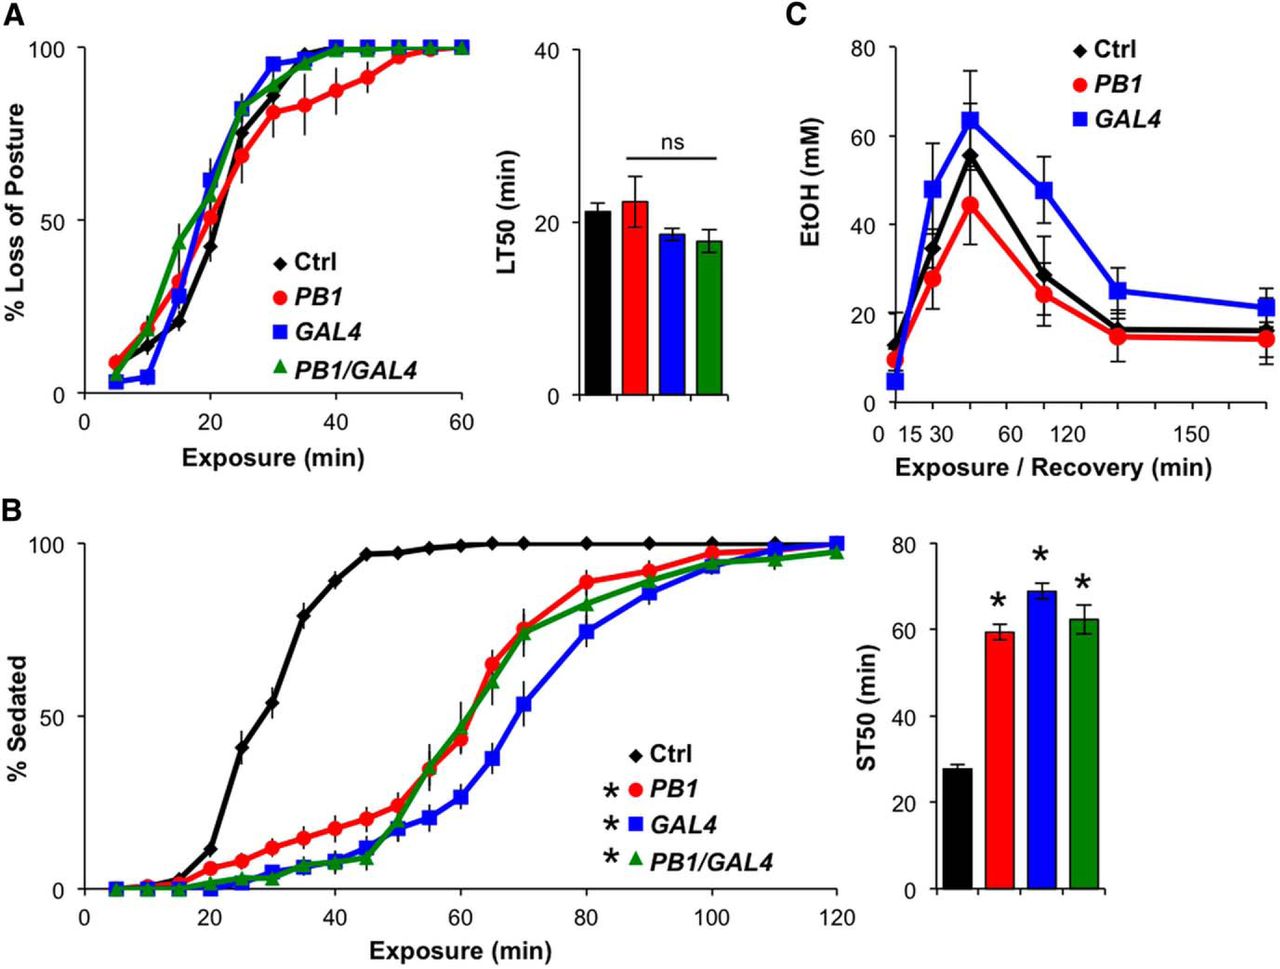
DopEcR mutants show increased resistance to ethanol-induced sedation. A, B, Behavioral responses of DopEcR mutants to ethanol vapor. Left, Percentage of flies exhibiting loss of posture (A) or sedation (B) as a function of ethanol exposure. Right, LT50 (A) or ST50 (B) as calculated by linear interpolation. Empty vials containing 8–10 control (Ctrl; w1118, n = 15), PB1 (DopEcRPB1, n = 15), GAL4 (DopEcRGAL4, n = 13), and PB1/GAL4 (DopEcRPB1/DopEcRGAL4, n = 13) flies were exposed to ethanol vapor and scored every 5 min. C, Ethanol absorption and metabolism among genotypes (n = 4, each with ∼30 flies). All figures display averages with SEM, with two-way repeated-measures ANOVA on ranks, Holm–Sidak (A and B, left; C), and ANOVA on ranks, Dunn's (A and B, right) versus control, *p < 0.05.


